
MATLAB: An Introduction with Applications
6th Edition
ISBN: 9781119256830
Author: Amos Gilat
Publisher: John Wiley & Sons Inc
expand_more
expand_more
format_list_bulleted
Related questions
Concept explainers
Question
The Chancellor wants you to calculate the
Expert Solution
arrow_forward
Step 1
Since we know population standard deviation, use z-distribution to find z-critical value.
Find z-critical value:

For the two-tail test, Area on each tail.
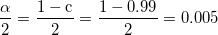
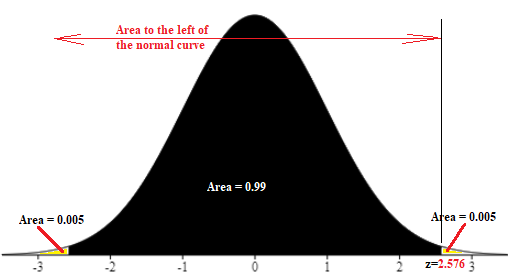
Area to the left of the normal curve = 1-0.005 = 0.995
Refer Standard normal table/Z-table, Lookup for z-score corresponding to area 0.995 to the left of the normal curve
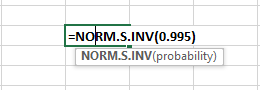
OR
Use excel formula "=NORM.S.INV(0.995)" to find the z-score.

Step by stepSolved in 2 steps with 14 images

Knowledge Booster


Learn more about
Need a deep-dive on the concept behind this application? Look no further. Learn more about this topic, statistics and related others by exploring similar questions and additional content below.Similar questions
- IQ is normally distributed with a mean of 100 and a standard deviation of 16. A local school is considering what its minimum IQ score should be for admission. What should the minimum IQ score be so that 90% of all students in the area can qualify for admission? How can I calculate this using Excel or by handarrow_forwardwe want to obtain a sample to estimate a population mean. Based on previous evidence, researchers believe the population standard deviation is approximately 38.7. We would like to be 99% confident that the estimate is within 4 of the true population mean. How large of a sample size is required ?arrow_forwardStatistics Questionarrow_forward
- The sample mean X is to be used to estimate the mean u of a normal distribution with standard deviation 4 inches. How large a sample should be taken in order chat, with 90% probability, the estimate will be in error by at most one-half inch?arrow_forwardA medical statistician wants to estimate the average weight loss of people who are on a new diet plan. In a preliminary study, he guesses that the standard deviation of the population of weight loss is about 8 pounds. How large a sample should he take to estimate the mean weight loss to within 4 pounds, with 97% confidence? Sample Size =arrow_forwardYou want to estimate the mean amount of time Internet users spend on Facebook each month. How many Internet users must be surveyed in order to be 90% confident that your sample mean is within 10 minutes of the population mean? Based on results from a prior survey, assume that the standard deviation of the population of monthly times spent on Facebook is 210 minutes.arrow_forward
- Loretta, who turns 91 this year, has heard that the mean systolic blood pressure among the elderly is 120 millimeters of mercury (mm Hg), but she believes that the actual value is higher. She bases her belief on a recently reported study of 19 randomly selected, elderly adults. The sample mean systolic blood pressure of the adults in the study was 121 mm Hg , and the sample standard deviation was 20 mm Hg. Assume that the population of systolic blood pressures of elderly adults is normally distributed. Based on the study, at the 0.1 level of significance, can it be concluded that μ , the mean systolic blood pressure among elderly adults, is greater than 120 mm Hg? Perform a one-tailed test. Then complete the parts below. Carry your intermediate computations to three or more decimal places and round your answers as specified in the table. (a) State the null hypothesis H0? and the alternative hypothesis H1? . H0:? H1:? (b) Determine the type of test statistic to…arrow_forwardYane is a researcher who studies bacteria. They are trying to ascertain the mean lifespan for a bacteria species. It is believed that the standard deviation of their lifespan is o = 4 hours. They would like to estimate the mean lifespan for this species of bacteria to within a margin of error of 0.45 hours at a 99% level of confidence. What sample size should they gather to achieve this? Remember your answer must be a whole number. n= bacteriaarrow_forwardThere is a new medication for diabetes, fifteen participants take the medication for fifteen days. The average blood glucose before taking the medication was 155 (population mean). The average blood glucose after taking the medication is 110. The standard deviation for the average glucose after taking the medication is 4.6. You want to evaluate if there is statistical evidence that there is a reduction in the mean glucose after taking the medication for 15 days. You must conduct a t-test. What is the t-statistic?arrow_forward
- You would like to make an interval estimate of a population mean from a sample of size 25. Assume the population standard deviation is 6. Assuming 98% Confidence, what is the margin for error for the estimate.arrow_forwardHow can get the standard deviation within the measures of dispersion or variability ?arrow_forward
arrow_back_ios
arrow_forward_ios
Recommended textbooks for you
- MATLAB: An Introduction with ApplicationsStatisticsISBN:9781119256830Author:Amos GilatPublisher:John Wiley & Sons Inc
 Probability and Statistics for Engineering and th...StatisticsISBN:9781305251809Author:Jay L. DevorePublisher:Cengage Learning
 Statistics for The Behavioral Sciences (MindTap C...StatisticsISBN:9781305504912Author:Frederick J Gravetter, Larry B. WallnauPublisher:Cengage Learning
  Elementary Statistics: Picturing the World (7th E...StatisticsISBN:9780134683416Author:Ron Larson, Betsy FarberPublisher:PEARSON
 The Basic Practice of StatisticsStatisticsISBN:9781319042578Author:David S. Moore, William I. Notz, Michael A. FlignerPublisher:W. H. Freeman
 Introduction to the Practice of StatisticsStatisticsISBN:9781319013387Author:David S. Moore, George P. McCabe, Bruce A. CraigPublisher:W. H. Freeman
MATLAB: An Introduction with Applications
Statistics
ISBN:9781119256830
Author:Amos Gilat
Publisher:John Wiley & Sons Inc
Probability and Statistics for Engineering and th...
Statistics
ISBN:9781305251809
Author:Jay L. Devore
Publisher:Cengage Learning
Statistics for The Behavioral Sciences (MindTap C...
Statistics
ISBN:9781305504912
Author:Frederick J Gravetter, Larry B. Wallnau
Publisher:Cengage Learning
Elementary Statistics: Picturing the World (7th E...
Statistics
ISBN:9780134683416
Author:Ron Larson, Betsy Farber
Publisher:PEARSON
The Basic Practice of Statistics
Statistics
ISBN:9781319042578
Author:David S. Moore, William I. Notz, Michael A. Fligner
Publisher:W. H. Freeman
Introduction to the Practice of Statistics
Statistics
ISBN:9781319013387
Author:David S. Moore, George P. McCabe, Bruce A. Craig
Publisher:W. H. Freeman