
MATLAB: An Introduction with Applications
6th Edition
ISBN: 9781119256830
Author: Amos Gilat
Publisher: John Wiley & Sons Inc
expand_more
expand_more
format_list_bulleted
Related questions
Concept explainers
Question

Transcribed Image Text:al
A A Aa-
A
E E AL T
v12
AaBbCcDc AaBbCcDc AaBbC AaBbCcl AaB AaBbCcC AaBbCcD
I U - ab
x, x' A
e- A-
三三=
1 Normal I No Spac. Heading 1 Heading 2
Title
Subtitle
Subtle Em.
Font
Paragraph
Styles
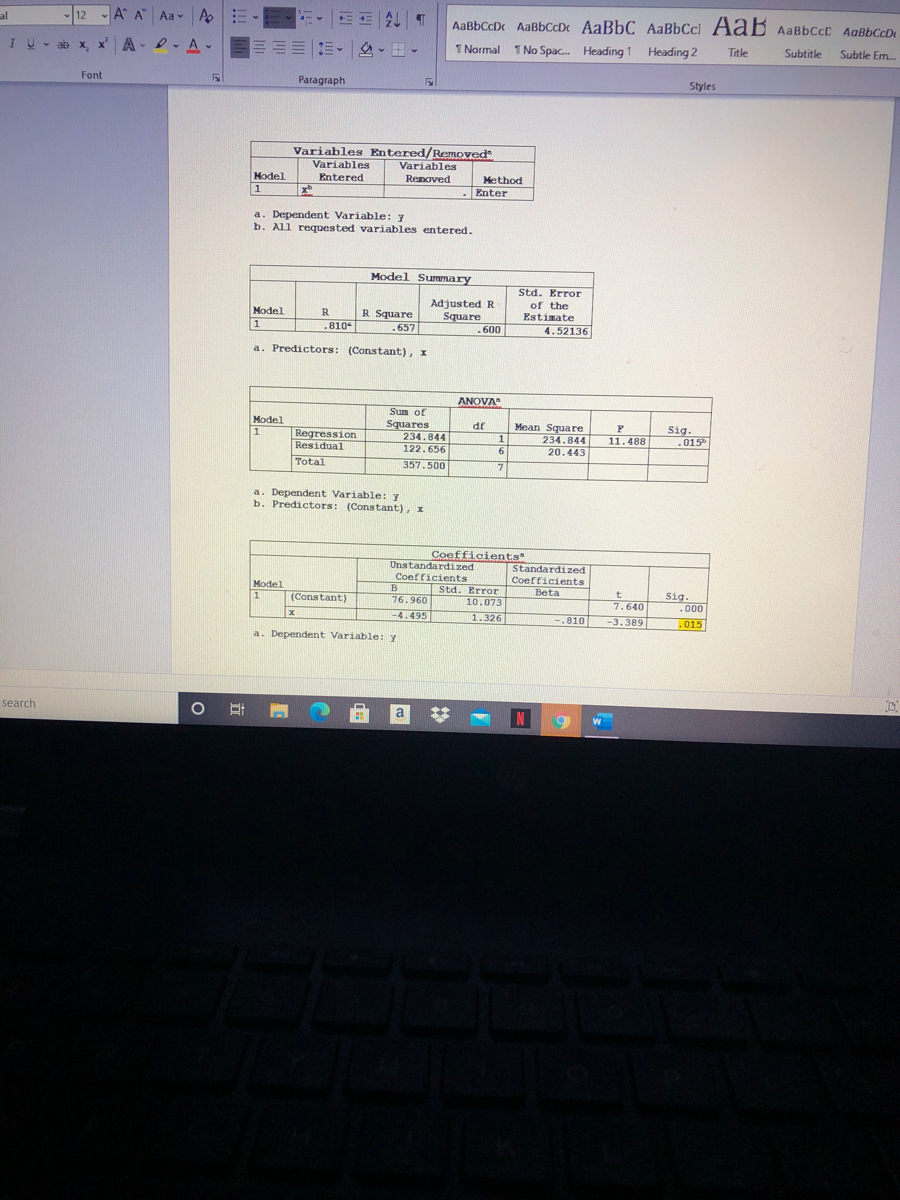
Variables Entered/Removed
Variables
Variables
Hodel
Entered
Renoved
Method
1
Enter
a. Dependent Variable: Y
b. All requested variables entered.
Model Sumenary
Std. Error
Adjusted R
of the
Estimate
Model
R
R Square
Square
.810
-657
600
4.52136
a. Predictors: (Constant), I
ANOVA
Sum of
Model
Squares
234.844
122.656
df
Mean Square
Regression
Residual
Sig.
.015
234.844
11.488
6.
20.443
Total
357.500
a. Dependent Variable: y
b. Predictors: (Constant), I
Coefficients
Unstandardized
Coefficients
Standardized
Coefficients
Beta
Model
B
TStd. Error
(Constant)
76.960
-4.495
Sig.
.000
10.073
7.640
7.640
1.326
-.810
-3.389
.015
a. Dependent Variable:Y
耳
search
a

Transcribed Image Text:3. Assume that a researcher is interested in the relationship between hours of sleep
and anxiety. Eight individuals are randomly selected and the amount of hours slept
and anxiety scores are measured. The scores are reported in the following table.
Hours of sleep (x)
Anxiety score (y)
5.5
55
6
47
8
45
7.25
50
8.5
35
39
8.75
39
36
Answer the following questions using the SPSS regression analysis OUTPUT
(given below):
a. From the SPSS regression analysis OUTPUT (given below), write the
estimated regression line of anxiety score (y) based on hours of sleep (x).
b. Does amount of sleep (x) significantly predicts the anxiety score (y), using a=
0.05? State your null and alternative hypotheses.
C. What is the predicted anxiety score (y) for someone who sleeps for 5 hours
(x)
D Focus
N
a
(?
Expert Solution
This question has been solved!
Explore an expertly crafted, step-by-step solution for a thorough understanding of key concepts.

This is a popular solution

Trending nowThis is a popular solution!

Step by stepSolved in 2 steps

Knowledge Booster


Learn more about
Need a deep-dive on the concept behind this application? Look no further. Learn more about this topic, statistics and related others by exploring similar questions and additional content below.Similar questions
- Is the price of a smartphone affected by its display size, camera resolution, or internal storage capacity? Perform a regression analysis on the SmartphoneDCS dataset and answer the following questions. The level of significance is .05. Solve this problem using MegaStat, and write your complete answers in the Response Box so I know that you can interpret the output. Attach your MegaStat file so I can see that you used the correct analysis method to solve this problem. Download: SmartphoneDCS a. Do the data conform to Evans' Rule? What about Doane's Rule? Show the calculations to explain the reason for your answers. b. State the decision rule for this analysis, and be sure to include the critical value(s). c. Perform the regression and write the complete regression equation. d. Is the overall fit of the model significant or not? Use the output from the ANOVA table and your answer to part (b) to explain your decision. e. What are the values for the coefficient of determination and…arrow_forwardIf a scatterplot is created in excel, and a line of regression is fit along with a derived functional form, what does it mean to describe and interpret them? What conclusions would be made about relationships between two recorded variables?arrow_forwardThe manager of the Bayville police department motor pool wants to develop a forecast model for annual maintenance on police cars, based on mileage in the past year and age of the cars. The following data have been collected for eight different cars: a. Using Excel, develop a multiple regression equation for these data. b. What is the coefficient of determination for this regression equation? c. Forecast the annual maintenance cost for a police car that is 5 years old and will be driven 10,000 miles in 1 year.arrow_forward
- If the R-squared for a regression model relating the outcome y to an explanatory variable x is 0.9. This implies that there is a positive linear relationship between y and x. True or false?arrow_forwardA researcher conducted a number of descriptive statistics for two variables X and Y. They were as follows: SP = 15; SSx = 3; My = 7; Mx = 3 What is b equal to (Please include the sign: e.g., -20)? What is a equal to (please include the sign: e.g., +4.0)? Using b and a construct a regression equation, and then using the regression equation, calculate the value of predicted Y when X = 2?arrow_forwardI need help with the test statistic only. Thanks.arrow_forward
- Do movies of different types have different rates of return on their budgets? Here's a regression of USGross (SM) on Budget for comedies and action movies with an indicator variable. Complete parts (a) through (d). Dependent variable is: USGross ($M) Coefficient SE(Coeff) - 6.78278 16.95 1.00523 Variable Constant Budget ($M) Comedy 24.0373 0.1613 11.73 t-ratio P-value -0.400 0.6907 6.23 <0.0001 2.05 0.0451 a) Write out the regression model. USGross = + ( Budget + (Comedy R-squared = 32.8% R-squared (adjusted) = 31.0% s = 47.51 55 degrees of freedomarrow_forwardThe local utility company surveys 12 randomly selected customers. For each survey participant, the company collects the following: annual electric bill (in dollars) and home size (in square feet). Output from a regression analysis appears below: Bill 13.45 + 4.39*Size Coefficients Estimate Std. Error (Intercept) 13.45 Size 4.39 0.54 0.2 We are 90% confident that the mean annual electric bill increases by between dollars and dollars for every additional square foot in home size. Round your answers to three decimal places and enter in increasing order.arrow_forwardA car dealership would like to develop a regression model that would predict the number of cars sold per month by a dealership employee based on theemployee's number of years of sales experience. The accompanying regression output was developed based on a random sample of employees. a. Predict the sales next month for an employee with 2.5 years of experience. The predicted sales is 8.6 cars. b. Compute the coefficient of determination and interpret its meaning. The coefficient of determination is 0.234 Therefore, about _________% of the variation in monthly sales is explained by the years of sales experience. (Type an integer or decimal rounded to one decimal place as needed.)arrow_forward
- The value of PRESS for five different regression models are A = 42.3, B = 47.4, C = 51.5, D =40.6, and E = 54.6. Based only on this statistic, which model is preferred?arrow_forwardAn automobile rental company wants to predict the yearly maintenance expense (Y) for an automobile using the number of miles driven during the year () and the age of the car (, in years) at the beginning of the year. The company has gathered the data on 10 automobiles and run a regression analysis with the results shown below:. Summary measures Multiple R 0.9689 R-Square 0.9387 Adj R-Square 0.9212 StErr of Estimate 72.218 Regression coefficients Coefficient Std Err t-value p-value Constant 33.796 48.181 0.7014 0.5057 Miles Driven 0.0549 0.0191 2.8666 0.0241 Age of car 21.467 20.573 1.0434 0.3314 Use the information above to estimate the annual maintenance expense for a 10 years old car with 60,000 miles.arrow_forwardLet's study the relationship between brand, camera resolution, and internal storage capacity on the price of smartphones. Use α = .05 to perform a regression analysis of the Smartphones01CS dataset, and then answer the following questions. When you copy and paste output from MegaStat to answer a question, remember to choose to "Keep Formatting" to paste the text. a. Did you find any evidence of multicollinearity and variance inflation among the predictors. Explain your answer using a VIF analysis. b. Copy and paste the normal probability plot for your analysis. Is there any evidence that the errors are not normally distributed? Explain. c. Copy and paste the Residuals vs. Predicted Y-values. Does the pattern support the null hypothesis of constant variance for the errors? Explain. d. Study the residuals analysis. Which observations, if any, have unusual residuals? e. Study the residuals analysis. Calculate the leverage statistic. Which observations, if any, are high leverage…arrow_forward
arrow_back_ios
arrow_forward_ios
Recommended textbooks for you
- MATLAB: An Introduction with ApplicationsStatisticsISBN:9781119256830Author:Amos GilatPublisher:John Wiley & Sons Inc
 Probability and Statistics for Engineering and th...StatisticsISBN:9781305251809Author:Jay L. DevorePublisher:Cengage Learning
 Statistics for The Behavioral Sciences (MindTap C...StatisticsISBN:9781305504912Author:Frederick J Gravetter, Larry B. WallnauPublisher:Cengage Learning
  Elementary Statistics: Picturing the World (7th E...StatisticsISBN:9780134683416Author:Ron Larson, Betsy FarberPublisher:PEARSON
 The Basic Practice of StatisticsStatisticsISBN:9781319042578Author:David S. Moore, William I. Notz, Michael A. FlignerPublisher:W. H. Freeman
 Introduction to the Practice of StatisticsStatisticsISBN:9781319013387Author:David S. Moore, George P. McCabe, Bruce A. CraigPublisher:W. H. Freeman
MATLAB: An Introduction with Applications
Statistics
ISBN:9781119256830
Author:Amos Gilat
Publisher:John Wiley & Sons Inc
Probability and Statistics for Engineering and th...
Statistics
ISBN:9781305251809
Author:Jay L. Devore
Publisher:Cengage Learning
Statistics for The Behavioral Sciences (MindTap C...
Statistics
ISBN:9781305504912
Author:Frederick J Gravetter, Larry B. Wallnau
Publisher:Cengage Learning
Elementary Statistics: Picturing the World (7th E...
Statistics
ISBN:9780134683416
Author:Ron Larson, Betsy Farber
Publisher:PEARSON
The Basic Practice of Statistics
Statistics
ISBN:9781319042578
Author:David S. Moore, William I. Notz, Michael A. Fligner
Publisher:W. H. Freeman
Introduction to the Practice of Statistics
Statistics
ISBN:9781319013387
Author:David S. Moore, George P. McCabe, Bruce A. Craig
Publisher:W. H. Freeman