
MATLAB: An Introduction with Applications
6th Edition
ISBN: 9781119256830
Author: Amos Gilat
Publisher: John Wiley & Sons Inc
expand_more
expand_more
format_list_bulleted
Related questions
Question
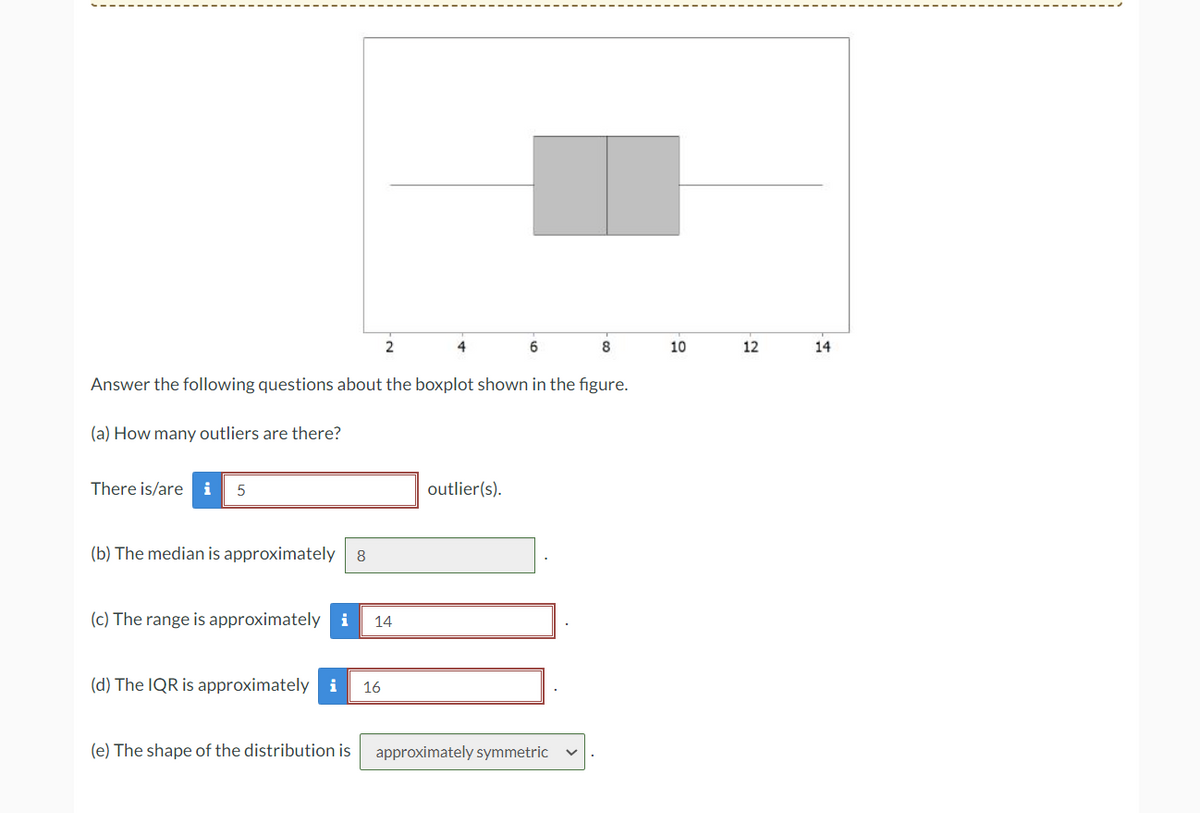

Transcribed Image Text:(a) How many outliers are there?
There is/are i 5
(b) The median is approximately
Answer the following questions about the boxplot shown in the figure.
8
(d) The IQR is approximately
2
(c) The range is approximately i 14
16
4
6
outlier(s).
8
(e) The shape of the distribution is approximately symmetric
10
12
14
Expert Solution
This question has been solved!
Explore an expertly crafted, step-by-step solution for a thorough understanding of key concepts.

This is a popular solution

Trending nowThis is a popular solution!

Step by stepSolved in 2 steps with 1 images

Knowledge Booster

Similar questions
- A teacher has 10 students in her class. She collected the finishing time (in minutes) of the mathematics testfor all students:20 24 22 32 23 25 37 26 40 35(a) Find the 25th percentile and 75th percentile of the data. (b) Find the median of the data. (c) Find the range and interquartile range of the data (d) Comment on the skewness of the data with a reason.arrow_forwardWhat does the "box" of a box-and-whisker plot encompass? Outliers None of these Minimum and maximum Q1, Q2, Q3arrow_forwardThe following data are the scores for 24 students on an algebra test. 70 38 62 49 26 26 51 14 64 66 55 66 100 34 63 58 75 77 36 65 81 64 51 55 90 Send data to calculator Send data to Excel Construct a box-and-whisker plot (sometimes called a boxplot) by adjusting the Use the to plot outliers, if any. DE H+ 0 5 10 15 20 25 30 35 40 45 50 55 60 65 70 75 SO 85 90 95 100arrow_forward
- Are cigarettes bad for people? Cigarette smoking involves tar, carbon monoxide, and nicotine (measured in milligrams). The first two are definitely not good for a person's health, and the last ingredient can cause addiction. Use the data in the table above to make a stem-and-leaf display for milligrams of tar per cigarette smoked. (Enter NONE in any unused answer blanks.) Are there any outliers? A. Yes, 1.0 may be an outlier. B. No, there are no outliers. C. Yes, 29.8 may be an outlier.arrow_forward1. The two plots have similar distrubutions. Are the distrubutions skewed left, approximtly symmetric, or skewed right? 2. Which is greater, the mean or the median, within each plot? Why does this make snese, gicen the type of distrubution you identified in the first part? 3. The population has drastically declined over recent years. Does the data show a difference in bee prefrence towards high quality hives versus how quality hives? Usse statistical evidennce to support your response.arrow_forward5:23 Pulse = 101 of ... 3.00-3.79 3.80-4.59 4.60-5.39 5.40-6.19 6.20-6.99 Pulse > 11 5 3 0 1 Chosen classes can vary. Aa 34. Twenty-nine executives reported the number of telephone calls made during a randomly selected week as shown here. Construct a stem and leaf plot for the data and analyze the results. 22 14 12 14 12 9 54 9 54 12 16 12 12 14 49 10 14 8 21 37 28 36 22 9 33 58 31 41 19 3 18 25 28 52 35. The National Insurance Crime Bureau reported that these data represent the number of 51 Garrow_forward
arrow_back_ios
arrow_forward_ios
Recommended textbooks for you
- MATLAB: An Introduction with ApplicationsStatisticsISBN:9781119256830Author:Amos GilatPublisher:John Wiley & Sons Inc
 Probability and Statistics for Engineering and th...StatisticsISBN:9781305251809Author:Jay L. DevorePublisher:Cengage Learning
 Statistics for The Behavioral Sciences (MindTap C...StatisticsISBN:9781305504912Author:Frederick J Gravetter, Larry B. WallnauPublisher:Cengage Learning
  Elementary Statistics: Picturing the World (7th E...StatisticsISBN:9780134683416Author:Ron Larson, Betsy FarberPublisher:PEARSON
 The Basic Practice of StatisticsStatisticsISBN:9781319042578Author:David S. Moore, William I. Notz, Michael A. FlignerPublisher:W. H. Freeman
 Introduction to the Practice of StatisticsStatisticsISBN:9781319013387Author:David S. Moore, George P. McCabe, Bruce A. CraigPublisher:W. H. Freeman
MATLAB: An Introduction with Applications
Statistics
ISBN:9781119256830
Author:Amos Gilat
Publisher:John Wiley & Sons Inc
Probability and Statistics for Engineering and th...
Statistics
ISBN:9781305251809
Author:Jay L. Devore
Publisher:Cengage Learning
Statistics for The Behavioral Sciences (MindTap C...
Statistics
ISBN:9781305504912
Author:Frederick J Gravetter, Larry B. Wallnau
Publisher:Cengage Learning
Elementary Statistics: Picturing the World (7th E...
Statistics
ISBN:9780134683416
Author:Ron Larson, Betsy Farber
Publisher:PEARSON
The Basic Practice of Statistics
Statistics
ISBN:9781319042578
Author:David S. Moore, William I. Notz, Michael A. Fligner
Publisher:W. H. Freeman
Introduction to the Practice of Statistics
Statistics
ISBN:9781319013387
Author:David S. Moore, George P. McCabe, Bruce A. Craig
Publisher:W. H. Freeman