MATLAB: An Introduction with Applications
6th Edition
ISBN: 9781119256830
Author: Amos Gilat
Publisher: John Wiley & Sons Inc
expand_more
expand_more
format_list_bulleted
Question
Please help with #18:
what are the unusual features of the sampling distribution?
a) outliers
b) none
c) skewed
d) influential obser

Transcribed Image Text:3
3
E
1
2
3
4
5
6
7
8
9
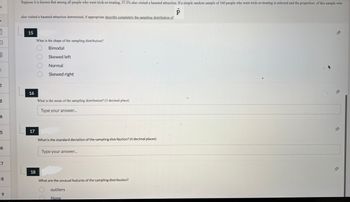
Suppose it is known that among all people who went trick-or-treating, 37.3% also visited a haunted attraction. If a simple random sample of 160 people who went trick-or-treating is selected and the proportion of this sample who
P
also visited a haunted attraction determined, if appropriate describe completely the sampling distribution of
15
What is the shape of the sampling distribution?
Bimodal
Skewed left
Normal
Skewed right
16
What is the mean of the sampling distribution? (3 decimal place)
Type your answer...
17
What is the standard deviation of the sampling distribution? (4 decimal places)
Type your answer...
18
What are the unusual features of the sampling distribution?
outliers
None
-
Expert Solution
This question has been solved!
Explore an expertly crafted, step-by-step solution for a thorough understanding of key concepts.
This is a popular solution
Trending nowThis is a popular solution!
Step by stepSolved in 2 steps

Knowledge Booster
Similar questions
- For the following set of sample data: {10, 50, 60, 70, 75 79, 85, 90, 91, 95, 100, 110} What is the lower limit for identifying an outlier?arrow_forwardFor a box plot, here are 4 values at the low end of a dataset and 4 values near the high end of a set of dataset: 18, 18, 18, 18 … 23, 23, 25, 25, … If the lower fence or boundary for outlier determination is 16 and the upper fence or boundary is 24, what value would you connect the whisker to on the high side of the “box?”arrow_forwardb. For the hypothetical salaries in the following dataset, what is the average salary per year? Dataset of hypothetical salaries: $45,000 per year, $20,000 per year, $33,000 per year, $27,000 per year, $91,000 per year. From question 9b, which salary is the outlier? What is the new average if you delete the outlier from your calculations?arrow_forward
- I do not understand this: "A listing is given specifying the percentage of the eligible voting age population that voted in each country for representatives to the European Parliament. The mean for that listing is lower than the median. Describe the distribution".arrow_forwardStudents in a statistics class were asked, “About how many minutes do you typically exercise in aweek?” Responses from the men in the class were “180, 300, 60, 480, 0, 90, 300, 14, 600, 360, 120, 0,240”(a) Create a five-number summary of the men’s responses.(b) Identify any potential outliers.arrow_forwardPlease helparrow_forward
- Can you please explain to me a good example of what the mean of sampling distribution is?arrow_forwardVineyards Here are summary statistics for the sizes (inacres) of Finger Lakes vineyards:a) Would you describe this distribution as symmetric orskewed? Explain.b) Are there any outliers? Explain.c) Create a boxplot of these data.d) Write a few sentences about the sizes of thevineyards.arrow_forwardThe table provides the number of Facebookfriends for a sample of 50 people aged 18to 25.a) Determine the percentiles for each of theNumber of Friends intervals.b) Determine the quartiles and theinterquartile range.c) Make a box and whisker plot.d) Determine whether there are any outliers.arrow_forward
- The whiskers in a boxplot extend to the? A. Outliers B. Most extreme values that are not potential outliers. C. Median D. First and third quartilearrow_forwardA SRS of 15 college students was undertaken to determine the number of hours they worked. The results are summarized below. 0 7 11 12 13 14 14 15 15 16 17 17 23 30 40 c) Find the interquartile range (IQR). d) Use the 1.5*IQR rule to determine if the data set has outliers. e) What are the outliers if any exist?arrow_forwardDescribe the natures of the two distributions (uniform, normal, skewed left, skewed right), and identify possible outliers.arrow_forward
arrow_back_ios
SEE MORE QUESTIONS
arrow_forward_ios
Recommended textbooks for you
 MATLAB: An Introduction with ApplicationsStatisticsISBN:9781119256830Author:Amos GilatPublisher:John Wiley & Sons Inc
 Probability and Statistics for Engineering and th...StatisticsISBN:9781305251809Author:Jay L. DevorePublisher:Cengage Learning
 Statistics for The Behavioral Sciences (MindTap C...StatisticsISBN:9781305504912Author:Frederick J Gravetter, Larry B. WallnauPublisher:Cengage Learning
 Elementary Statistics: Picturing the World (7th E...StatisticsISBN:9780134683416Author:Ron Larson, Betsy FarberPublisher:PEARSON
 The Basic Practice of StatisticsStatisticsISBN:9781319042578Author:David S. Moore, William I. Notz, Michael A. FlignerPublisher:W. H. Freeman
 Introduction to the Practice of StatisticsStatisticsISBN:9781319013387Author:David S. Moore, George P. McCabe, Bruce A. CraigPublisher:W. H. Freeman

MATLAB: An Introduction with Applications
Statistics
ISBN:9781119256830
Author:Amos Gilat
Publisher:John Wiley & Sons Inc

Probability and Statistics for Engineering and th...
Statistics
ISBN:9781305251809
Author:Jay L. Devore
Publisher:Cengage Learning

Statistics for The Behavioral Sciences (MindTap C...
Statistics
ISBN:9781305504912
Author:Frederick J Gravetter, Larry B. Wallnau
Publisher:Cengage Learning

Elementary Statistics: Picturing the World (7th E...
Statistics
ISBN:9780134683416
Author:Ron Larson, Betsy Farber
Publisher:PEARSON

The Basic Practice of Statistics
Statistics
ISBN:9781319042578
Author:David S. Moore, William I. Notz, Michael A. Fligner
Publisher:W. H. Freeman

Introduction to the Practice of Statistics
Statistics
ISBN:9781319013387
Author:David S. Moore, George P. McCabe, Bruce A. Craig
Publisher:W. H. Freeman