MATLAB: An Introduction with Applications
6th Edition
ISBN: 9781119256830
Author: Amos Gilat
Publisher: John Wiley & Sons Inc
expand_more
expand_more
format_list_bulleted
Question

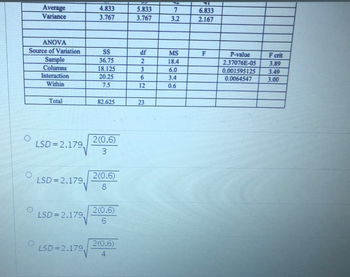
Transcribed Image Text:ANOVA
Source of Variation
O
Average
Variance
O
Sample
Columns
Interaction
Within
Total
LSD=2.179,
LSD=2.179₁
LSD=2.179,
LSD=2.179,
4.833
3.767
SS
36.75
18.125
20.25
7.5
82.625
2(0.6)
3
2(0.6)
8
2(0.6)
6
2(0.6)
4
5.833
3.767
df
723
6
12
23
7
3.2
MS
18.4
6.0
3.4
0.6
6.833
2.167
F
P-value
F crit
2.37076E-05
3.89
0.001595125 3.49
0.0064547
3.00

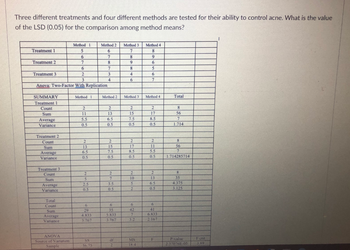
Transcribed Image Text:Three different treatments and four different methods are tested for their ability to control acne. What is the value
of the LSD (0.05) for the comparison among method means?
Treatment 1
Treatment 2
Treatment 3
SUMMARY
Treatment 1
Count
Sum
Average
Variance
Treatment 2
Count
Sum
Average
Variance
Treatment 3
Count
Sum
Average
Variance
3
Anova: Two-Factor With Replication
Total
Count
Sum
Average
Variance
Method 1
5
6
7
ANOVA
Source of Variation
Sample
6
2
Method 1
2
11
5.5
0.5
2
13
6.5
0.5
2
5
2.5
0.5
6
29
4.833
3.767
Method 2
6
SS
36,75
7
8
7
3
4
Method 2
2
13
6.5
0.5
2
15
7.5
0.5
2
7
3.5
0.5
6
35
5.833
3.767
df
2
Method 3
7
8
9
8
4
6
Method 3
2
15
7.5
0.5
2
17
8.5
0.5
2
10
5
2
6
42
7
3.2
MS
18.4
Method 4
8
9
6
5
6
7
Method 4
2
17
8.5
0.5
2
11
5.5
0.5
2
13
6.5
0.5
6
41
6.833
2.167
F
Total
8
56
7
1.714
8
56
7
1.714285714
8
35
4.375
3.125
P-value
2:370761-05
F crit
3.89
Expert Solution
This question has been solved!
Explore an expertly crafted, step-by-step solution for a thorough understanding of key concepts.
Step by stepSolved in 2 steps with 2 images

Knowledge Booster
Similar questions
- Question: How to describe normal distribution and skewed in the histogram and density plots in general. Also, explain any correlation we observe between the response and predictor variables in any scatter plots in general.arrow_forwardMail X Gene × b Succe x YouTube M Gmail V Books ✰ nightingale.instructure.com/courses/3367087/assignments/33979308?module_item_id=76315289 Kinnser Software Mail - Hayley Murra... The data shown below consists of the price (in dollars) of 7 events at a local venue and the number of people who attended. Determine if there is significant negative linear correlation between ticket price and number of attendees. Use a significance level of 0.01 and round all values to 4 decimal places. Week X ← → C Account Dashboard Courses 28 Groups looo HEI Calendar 凸 Inbox H History R Studio Logi X M Inbox x 2022-2 Home Announcements Syllabus Modules Grades People Office 365 Secure Exam Proctor (Proctorio) Library Make Tuition Payment Accredible Class Notebook Unicheck Type here to search Bookshelf Ambassa... Ticket Price 6 10 14 18 22 26 30 34 Ho: p = 0 Ha: p < 0 Find the Linear Correlation Coefficient Find the p-value p-value = Attendence 152 141 147 143 138 138 131 132 The p-value is O Greater than a…arrow_forwardStatistics students in Oxnard College sampled 11 textbooks in the Condor bookstore and recorded the number of pages in each textbook and its cost. The bivariate data is shown below, Number of Pages (xx) Cost(yy) 942 59.1 453 24.65 789 41.45 473 34.65 302 25.1 567 23.35 482 32.1 511 26.55 285 28.25 529 35.45 477 19.85 Click to Copy-and-Paste DataA student calculates a linear modelyy = xx + . (Please show your answers to two decimal places)Use the model above to estimate the cost when the number of pages is 736Cost = $ (Please show your answer to 2 decimal places.)arrow_forward
- Ques = Homework: Ch 8 - Sampling Distributions Critical values of the correlation coefficient ars. Com - X Int. Critical Values for Correlation Coefficient Data table 3 0,997 4 0.950 5 0.878 6 0.811 7 0.754 Year Rate of Return of Company Rate of Return of Company ble. Chod 6 2 2007 0.203 0.402 8 0.707 9 0.666 10 0.632 2008 0.310 0.510 2009 0.267 0.410 11 0.602 12 0.576 13 0.553 14 0.532 15 0.514 16 0.497 2010 0.195 0.426 2011 -0.101 -0.060 2012 - 0.130 -0.151 2013 -0.234 -0.357 2014 0.264 0.328 17 0.482 18 0.468 19 0.456 20 0.444 21 0.433 2015 0.090 0.207 2016 0.030 -0.014 2017 0.128 0.113 2018 - 0.035 0.027 22 0.423 23 0.413 24 0.404 25 0.396 Print Done 26 0.388 27 0.381 Tne correlauon coeicient is- (Round to three decimal places as needed.) Print Donearrow_forwardesc ! Frequency 1 7 13 19 25 31 37 data a Based on the histogram above, what is the class width? Class width=6 What is the sample size? Sample size = Submit Question F1 Q @ 2 F2 W 20 #3 F3 E DDD 000 S4 $ F4 R 1 % 5 F5 6 MacBook Air T ^ 6 F6 ◄◄ & Y 7 F7 * 8arrow_forwardAnalysis of Variance results: Where: Age > 5Responses: AgeFactors: Sex Response statistics by factor Sex n Mean Std. Dev. Std. Error female 121 10.490083 4.2222704 0.38384277 male 155 9.0806452 3.0091656 0.241702 ANOVA table Source DF SS MS F-Stat P-value Sex 1 134.98939 134.98939 10.466692 0.0014 Error 274 3533.79 12.897044 Total 275 3668.7794 Tukey HSD results (95% level) female subtracted from Difference Lower Upper P-value male -1.4094375 -2.2670907 -0.55178425 0.0014 In one complete sentence, interpret your confidence interval. Make sure in the interpretation it is clear the direction of the difference (i.e. which gender weighs more and by how much. Explain why a confidence interval provides more information to a tiger researcher than the results of a hypothesis testarrow_forward
- Question 3 > Find the first and third quartile for the data shown 5.3 13 14.6 15.5 16.3 17 17.4 18.3 19.2 20.3 Q1 = %3D Q3 = %3D Submit Questionarrow_forward6arrow_forwarddules Statistics students in Oxnard College sampled 9 textbooks in the Condor bookstore, and recorded number of pages in each textbook and its cost. The bivariate data is shown below, nferences laborations Number of Pages (I) Cost(y) 615 34.9 ogle Drive 314 32.84 599 31.94 ice 365 357 32.42 860 58.6 dent Course luations 973 64.38 679 51.74 250 24 748 51.88 A student calculates a linear model (Please show your answers to two decimal places) %3D Use the model above to estimate the cost when number of pages is 520 Cost = $| (Please show your answer to 2 decimal places.) Enter an integer or decimal number (more... Question Help: Message instructor Submit Question e to search Narrow_forward
arrow_back_ios
arrow_forward_ios
Recommended textbooks for you
 MATLAB: An Introduction with ApplicationsStatisticsISBN:9781119256830Author:Amos GilatPublisher:John Wiley & Sons Inc
 Probability and Statistics for Engineering and th...StatisticsISBN:9781305251809Author:Jay L. DevorePublisher:Cengage Learning
 Statistics for The Behavioral Sciences (MindTap C...StatisticsISBN:9781305504912Author:Frederick J Gravetter, Larry B. WallnauPublisher:Cengage Learning
 Elementary Statistics: Picturing the World (7th E...StatisticsISBN:9780134683416Author:Ron Larson, Betsy FarberPublisher:PEARSON
 The Basic Practice of StatisticsStatisticsISBN:9781319042578Author:David S. Moore, William I. Notz, Michael A. FlignerPublisher:W. H. Freeman
 Introduction to the Practice of StatisticsStatisticsISBN:9781319013387Author:David S. Moore, George P. McCabe, Bruce A. CraigPublisher:W. H. Freeman

MATLAB: An Introduction with Applications
Statistics
ISBN:9781119256830
Author:Amos Gilat
Publisher:John Wiley & Sons Inc

Probability and Statistics for Engineering and th...
Statistics
ISBN:9781305251809
Author:Jay L. Devore
Publisher:Cengage Learning

Statistics for The Behavioral Sciences (MindTap C...
Statistics
ISBN:9781305504912
Author:Frederick J Gravetter, Larry B. Wallnau
Publisher:Cengage Learning

Elementary Statistics: Picturing the World (7th E...
Statistics
ISBN:9780134683416
Author:Ron Larson, Betsy Farber
Publisher:PEARSON

The Basic Practice of Statistics
Statistics
ISBN:9781319042578
Author:David S. Moore, William I. Notz, Michael A. Fligner
Publisher:W. H. Freeman

Introduction to the Practice of Statistics
Statistics
ISBN:9781319013387
Author:David S. Moore, George P. McCabe, Bruce A. Craig
Publisher:W. H. Freeman