
A First Course in Probability (10th Edition)
10th Edition
ISBN: 9780134753119
Author: Sheldon Ross
Publisher: PEARSON
expand_more
expand_more
format_list_bulleted
Related questions
Question
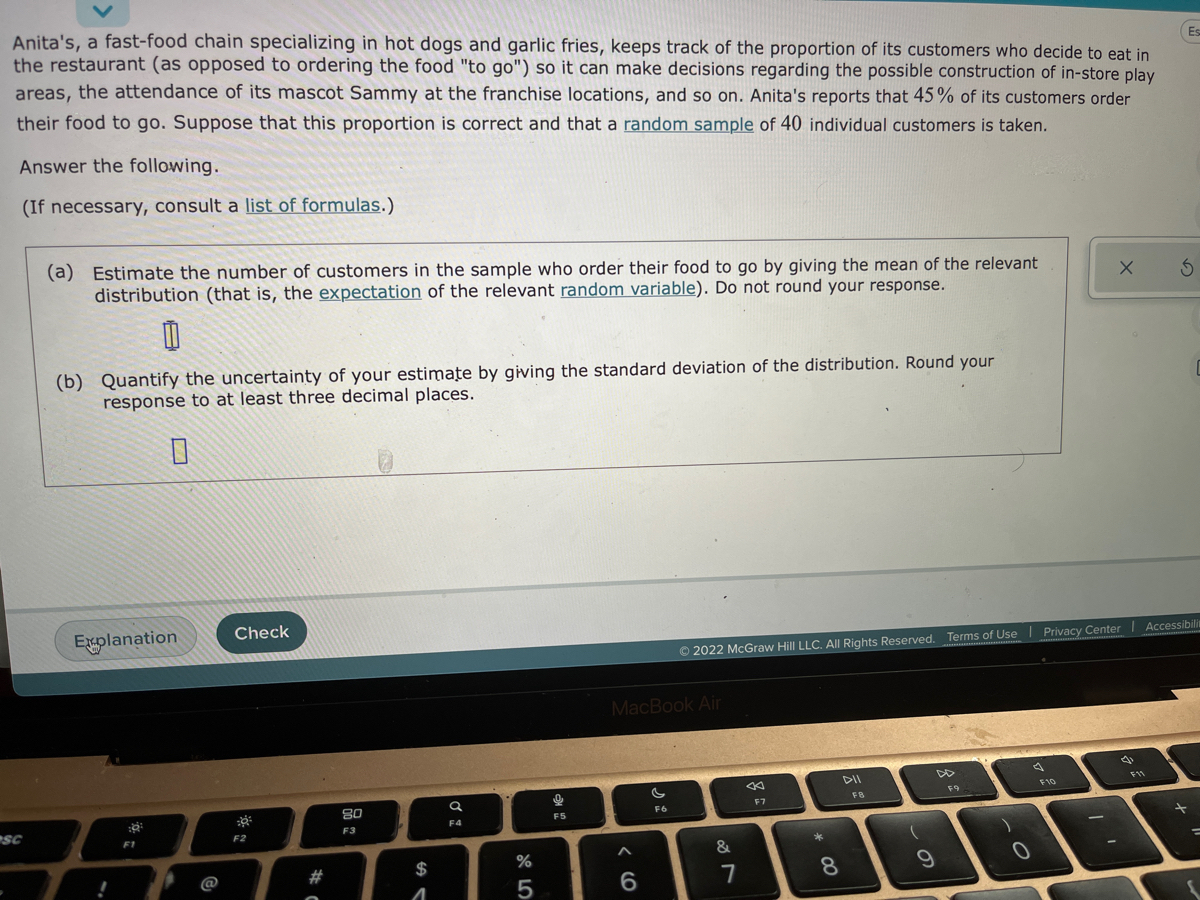

Transcribed Image Text:Anita's, a fast-food chain specializing in hot dogs and garlic fries, keeps track of the proportion of its customers who decide to eat in
Es
the restaurant (as opposed to ordering the food "to go") so it can make decisions regarding the possible construction of in-store play
areas, the attendance of its mascot Sammy at the franchise locations, and so on. Anita's reports that 45% of its customers order
their food to go. Suppose that this proportion is correct and that a random sample of 40 individual customers is taken.
Answer the following.
(If necessary, consult a list of formulas.)
(a) Estimate the number of customers in the sample who order their food to go by giving the mean of the relevant
distribution (that is, the expectation of the relevant random variable). Do not round your response.
(b) Quantify the uncertainty of your estimațe by giving the standard deviation of the distribution. Round your
response to at least three decimal places.
Eplanation
Check
© 2022 McGraw Hill LLC. AIIL Rights Reserved. Terms of Use I Privacy Center I Accessibilit
MacBook Air
DII
F11
F9
F10
80
F7
FB
F6
sc
F4
F5
F3
F1
F2
*
@
#
$
8.
Expert Solution
This question has been solved!
Explore an expertly crafted, step-by-step solution for a thorough understanding of key concepts.

Step by stepSolved in 2 steps with 2 images

Knowledge Booster

Similar questions
- In a 2015 nationally-representative sample of youth in grades 9-12: 22.6% reported being in a physical fight in the 12 months preceding the survey; the prevalence was higher among males (28.4%) than females (16.5%). 16.2% reported carrying a weapon (gun, knife, or club) on one or more days in the 30 days preceding the survey; the prevalence was higher among males (24.3%) than females (7.5%). 5.3% reported carrying a gun on one or more days in the 30 days preceding the survey; the prevalence was higher among males (8.7%) than females (1.6%). Make an inference: What do these statistics reveal about teenagers and violence?arrow_forwardThe National Highway Association is studying the relationship between the number of bidders on a highway project and the winning (lowest) bid for the project. Of particular interest is whether the number of bidders increases or decreases the amount of the winning bid. Bidders Price 9.0 5.1 9.0 8.0 3.0 9.7 10.0 7.8 5.0 7.7 10.0 5.5 7.0 8.3 11.0 5.5 6.0 10.3 6.0 8.0 4.0 8.8 7.0 9.4 7.0 8.6 7.0 8.1 6.0 7.8 Given: Correlation of Coefficient: 0.7064 (This is correct) Coefficient of determination: 49.90% (This is correct) ŷ = 11.2360 + (-0.4667)x (This is correct) Create a scatter plot of the data Complete a regression analysis of the relationship. Slope = ______ Estimate the winning bid if there were seven bidders. Winning bid cost ______ millions. Compute the 95% prediction interval for a winning bid if there are seven bidders. [ _____________, ______________]arrow_forwardThe following table displays blood pressure status by sex. Optimal Normal Hypertension Total Male 22 73 55 150 Female 43 132 65 240 Total 65 205 120 390 a. What proportion of the participants has optimal blood pressure? b. What proportion of men has optimal blood pressure? c. What proportion of participants with hypertension is male? d. Are hypertensive status and male gender independent?arrow_forward
- A poll tracks the favorite sport of Americans who follow at least one sport. Results of the poll show that professional football is the favorite sport of 33% of Americans who follow at least one sport, followed by baseball at 15%, men's college football at 10%, auto racing at 6%, men's professional basketball at 5%, and ice hockey at 5%, with other sport at 26%. Consider a survey in which 344 college undergraduates who follow at least one sport were asked to identify their favorite sport produced the following results: Professional Football 113 Baseball 38 Men's College Football 47 Auto Racing 12 Men's Professional Basketball 8 Ice Other Hockey Sports Find the p-value. (Round your answer to four decimal places.) p-value = 19 107 Do college undergraduate students differ from the general public with regard to their favorite sports? Use α = 0.05. State the null and alternative hypotheses. O Ho: Undergraduate students do not differ from the general public with regard to their favorite…arrow_forwardIn the Focus Problem at the beginning of this chapter, a study was described comparing the hatch ratios of wood duck nesting boxes. Group I nesting boxes were well separated from each other and well hidden by available brush. There were a total of 485 eggs in group I boxes, of which a field count showed about 274 hatched. Group II nesting boxes were placed in highly visible locations and grouped closely together. There were a total of 790 eggs in group II boxes, of which a field count showed about 262 hatched. (a) Find a point estimate p̂1 for p1, the proportion of eggs that hatch in group I nest box placements. (Round your answer to three decimal places.)p̂1 = Find a 95% confidence interval for p1. (Round your answers to three decimal places.) lower limit upper limit (b) Find a point estimate p̂2 for p2, the proportion of eggs that hatch in group II nest box placements. (Round your answer to three decimal places.)p̂2 = Find a 95% confidence interval for p2. (Round…arrow_forwardnita's, a fast-food chain specializing in hot dogs and garlic fries, keeps track of the proportion of its customers who decide to eat in the restaurant (as opposed to ordering the food "to go"), so it can make decisions regarding the possible construction of in-store play areas, the attendance of its mascot Sammy at the franchise locations, and so on. Anita's reports that 48% of its customers order their food to go. If this proportion is correct, what is the probability that, in a random sample of 4 customers at Anita's, exactly 3 order their food to go? Round your response to at least three decimal places.arrow_forward
- Opinions are split about a coffee company's pumpkin-flavored coffee (PFC). Yet every year over the last five years the consumption of pumpkin-flavored goods has increased. If we look at the numbers, it also becomes clear why a leading coffee company keeps offering the PFC earlier and earlier every year. According to a magazine, the amount spent by PFC buyers at the coffee company is about 17% higher than non-PFC buyers. The accompanying table shows a random sample of eight consumers, the amount they spend per week, and the number of PFCs purchased per week. PFC Spending 2 13.88 7 39.11 4 19.79 1 9.84 3 15.43 1 21.52 5 37.39 3 13.85 Calculate the slope and y-intercept for the regression formula. The slope is b1=4.465 The y-intercept is b0=6.840 Provide an interpretation for the value of the slope. Because the slope is positive, it can be…arrow_forwardKindly assist with creating bar charts, or pie charts for the below results; Housekeeping respondents were questioned about their observations regarding changes or improvements in gender diversity over recent months or years. All respondents (100%) acknowledged witnessing recent promotions between both genders within Housekeeping and other departments. Similarly, 80% of Guest Services department respondents shared similar observations. Conversely, 75% of respondents from the food and beverage department indicated that they have not observed any changes or improvements in gender diversity, particularly within their own department.arrow_forwardA friend who lives in Los Angeles makes frequent consulting trips to Washington, D.C.; 60% of the time she travels on airline # 1, 20% of the time on airline on airline # 3. For airline #1, flights are late into D.C. 40% of the time and late into L.A. 15% of the time. For airline #2, these percentages are 35% and 10%. If we learn that on a particular trip she arrived late at exactly one of the two destinations, and # 3? Assume that the chance of a late arrival in L.A. is unaffected by what happens on the flight to D.C. [Hint: second-generation branches labeled, respectively, 0 late, 1 late, and 2 late.] (Round your answers to four decimal airline #1 airline #2 airline #3 20% of the time whereas #2, and the remaining percentages for airline #3 the what are flown on airlines From the tip of each first-generation branch on a tree diagram, draw three places.) the posterior of having #1, #2, and 15%, probabilities are 35%arrow_forward
- In the Focus Problem at the beginning of this chapter, a study was described comparing the hatch ratios of wood duck nesting boxes. Group I nesting boxes were well separated from each other and well hidden by available brush. There were a total of 475 eggs in group I boxes, of which a field count showed about 274 hatched. Group II nesting boxes were placed in highly visible locations and grouped closely together. There were a total of 796 eggs in group II boxes, of which a field count showed about 274 hatched. (a) Find a point estimate p1 for P1, the proportion of eggs that hatch in group I nest box placements. Find a 99% confidence interval for p1. (Use 3 decimal places.) P1 lower limit upper limit (b) Find a point estimate p2 for p2, the proportion of eggs that hatch in group II nest box placements. Find a 99% confidence interval for p2. (Use 3 decimal places.) lower limit upper limit (c) Find a 99% confidence interval for p1 – P2. (Use 3 decimal places.) lower limit upper limit Does…arrow_forwardUniversity researchers published a working paper. One of the objectives of the study was to determine whether ride-share drivers actually make a profit.arrow_forwardA gym wishes to evaluate the effectiveness of its programs. When a new member joins the gym, they meet with a trainer who designs a recommended routine based on the member’s current fitness and their goals. The recommended routines can be classified into high, medium, or low effort. Historically, 68% of the new members get a high effort routine, 21% get a medium effort routine, and the rest get a low effort routine. After the first six months as members, the gym surveys the members’ adherence to the recommended routine. The gym classifies a member’s performance as optimal if they follow the recommended routine for the six months, or as inferior otherwise. According to the historical results of the survey, 84% of the members with a low effort routine, 22% of the members with a medium effort routine, and 69% of the members with a high effort routine report optimal performance. After the first six months of joining the gym, a member can obtain different results: they can either…arrow_forward
arrow_back_ios
SEE MORE QUESTIONS
arrow_forward_ios
Recommended textbooks for you
- A First Course in Probability (10th Edition)ProbabilityISBN:9780134753119Author:Sheldon RossPublisher:PEARSON

A First Course in Probability (10th Edition)
Probability
ISBN:9780134753119
Author:Sheldon Ross
Publisher:PEARSON