
MATLAB: An Introduction with Applications
6th Edition
ISBN: 9781119256830
Author: Amos Gilat
Publisher: John Wiley & Sons Inc
expand_more
expand_more
format_list_bulleted
Related questions
Question
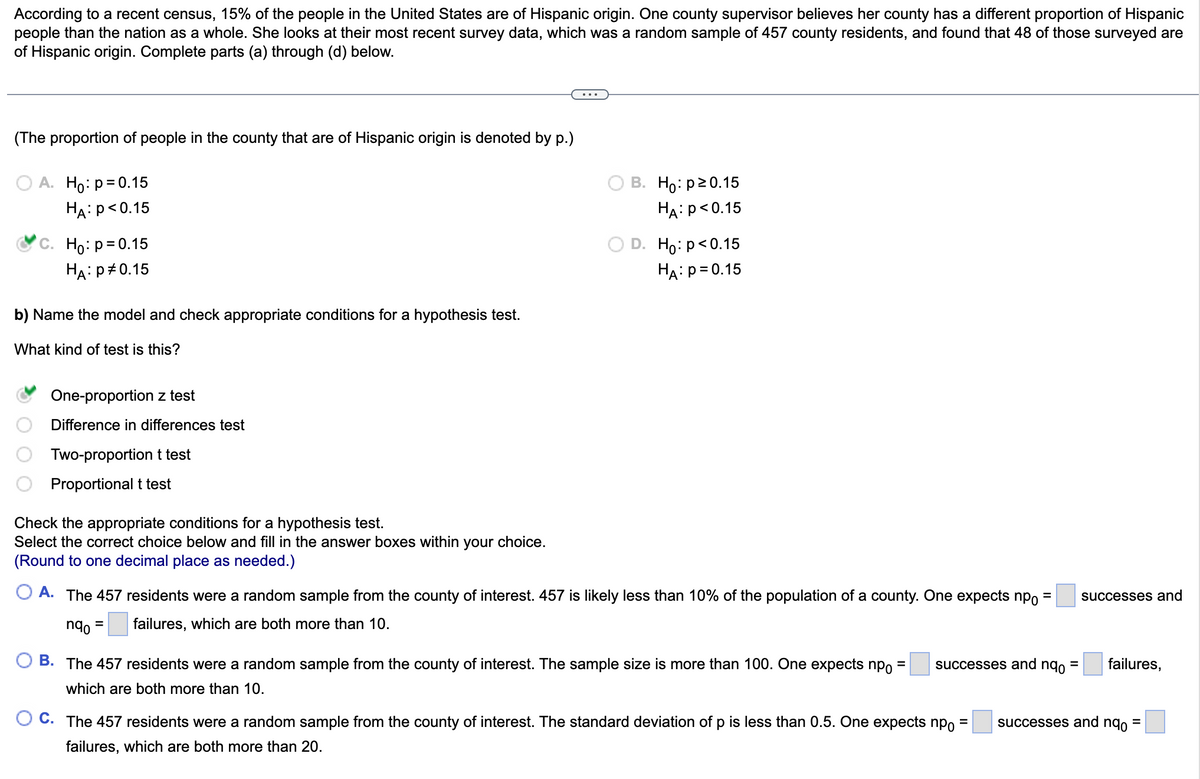

Transcribed Image Text:According to a recent census, 15% of the people in the United States are of Hispanic origin. One county supervisor believes her county has a different proportion of Hispanic
people than the nation as a whole. She looks at their most recent survey data, which was a random sample of 457 county residents, and found that 48 of those surveyed are
of Hispanic origin. Complete parts (a) through (d) below.
(The proportion of people in the county that are of Hispanic origin is denoted by p.)
A. Ho: p = 0.15
HA: P<0.15
C. Ho: p=0.15
HA: P 0.15
b) Name the model and check appropriate conditions for a hypothesis test.
What kind of test is this?
One-proportion z test
Difference in differences test
Two-proportion t test
Proportional t test
Check the appropriate conditions for a hypothesis test.
Select the correct choice below and fill in the answer boxes within your choice.
(Round to one decimal place as needed.)
B. Ho: p20.15
HA: P<0.15
D. Ho: p<0.15
HA: P = 0.15
=
A. The 457 residents were a random sample from the county of interest. 457 is likely less than 10% of the population of a county. One expects npo
nqo =
failures, which are both more than 10.
B. The 457 residents were a random sample from the county of interest. The sample size is more than 100. One expects np =
which are both more than 10.
successes and nqo
O C. The 457 residents were a random sample from the county of interest. The standard deviation of p is less than 0.5. One expects np
failures, which are both more than 20.
=
=
successes and
failures,
successes and nqo =
Expert Solution
This question has been solved!
Explore an expertly crafted, step-by-step solution for a thorough understanding of key concepts.

This is a popular solution

Trending nowThis is a popular solution!

Step by stepSolved in 2 steps

Knowledge Booster

Similar questions
- CHAPTER 16 CLASSWORK 1. Find the mean for the following lists of numbers. (Round to the nearest tenth) a. Algebra quiz scores: 32, 26, 30, 19, 51, 46, 38, 39 b. Average number of defects per school: 10.6, 12.5, 11.7, 9.6, 10.3, 9.6, 10.9, 6.4, 2.3, 4.1 2. Find the mode or modes for each of the following lists of numbers a. Number of students graduating with honors: 85, 69, 72, 69, 103, 81, 98. b. Number of fifth grade students: 32, 38, 32, 36, 38, 34, 35, 30, 39 3. Find the median of following numbers. (Round to the nearest hundredth) a. 35, 33, 32, 34, 35, 34, 35, 35, 34 b. 35, 33, 34, 35, 34, 35, 35, 34arrow_forwardThe following gives the national percentages of adults in a given age group. Use Google Sheets or another app/program to create a pie chart that clearly displays this data to an audience. Copy and paste the chart into a document to upload as part of your problem set.Age Group 18 – 29 30 – 44 45 – 59 60 or olderPercentage 17 27 25 31arrow_forward3. The number of tie-breaking votes cast by each of the 21 vice presidents of the United States who served during the twentieth century are shown. Draw a histogram for this data: 0, 0, 4, 10, 0, 2, 3, 3, 4, 1, 7, 8, 0, 4, 2, 0, 0, 1, 7, 0, 4 esc FI F2 ㅁㅁ F3 F4 F5 MacBook Air F6 F7 * F8 F9 F10 F11 + 1/ F12arrow_forward
- In Exercises 33 to 36, determine whether or not the conditions for using two-sample t procedures are met. 33. Shoes How many pairs of shoes do teenagers have? To find out, a group of AP® Statistics students conducted a survey. They selected a random sample of 20 female students and a separate random sample Females 333 95 4332 66 410 8 9 100 7 0 0 4455 WW~~ 1 1 2 2 2 Males 4 3 555677778 0000124 3 58 Key: 22 represents a male student with 22 pairs of shoes.arrow_forwardPlease answer questions below Below is a sample of 64 responses of a survey of Ward 3 residents in Washington, D.C. The survey asked "Do you support the statehood of Washington, D.C.?" "Yes" was recorded as "1" and "No" was recorded as "0" in the table. Statehood? a. What is the sample proportion of residents who support DC statehood? 1 1 1 1 0 1 b. If the population proportion of residents who support DC statehood is 0.7, 1 what is the standard error of the proportion? 0 0 0 1 1 c. Is the sampling distribution of the proportion normally distributed? 0 1 1 0 1 d. What is the probability of a sample proportion being greater than 1 the value of…arrow_forwardThe International League of Triple-A minor league baseball consists of 14 teams organized into three divisions: North, South, and West. Suppose the following data show the average attendance for the 14 teams in the International League. Also shown are the teams' records; W denotes the number of games won, L denotes the number of games lost, and PCT is the proportion of games played that were won. Team Name Buffalo Bisons Lehigh Valley IronPigs Pawtucket Red Sox Rochester Red Wings Scranton-Wilkes Barre Yankees Syracuse Chiefs Charlotte Knights Durham Bulls Norfolk Tides Richmond Braves Columbus Clippers Indianapolis Indians Louisville Bats Toledo Mud Hens Division North North North North North North South South South West West West WL West 66 77 0.462 55 89 0.382 85 58 South 63 78 0.447 PCT 88 56 74 70 0.514 69 73 0.594 0.611 0.486 69 73 74 70 0.514 64 78 0.451 63 78 0.447 0.486 68 76 0.472 88 56 0.611 75 69 0.521 Attendance 8,819 8,478 9,099 6,917 7,141 5,769 4,525 6,998 6,284 4,451…arrow_forward
- The table shows the political party affiliations for a medium-sized neighborhood with 94 adults. If the neighborhood is representative of a town with an adult population of 9000, approximately how many of them are likely to be Independents? Number Political Party 34 Republicans 42 Democrats 12 Independents 6 Libertarians A 1150 B 1500 С 2800 4000arrow_forwardIn marketing children’s products, it is extremely important to produce television commercials that hold the attention of the children who view them. A psychologist hired by a marketing research firm wants to determine whether differences in attention span exist among advertisements for different types of products. A number of children under 10 years of age are asked to watch one 60-second commercial for one of three types of products, and their attention spans are measured in seconds. The results are shown in the accompanying table: Type of Product Advertised Toys/Games Food/Candy Children’s Clothing 42 55 30 45 58 35 48 52 42 40 60 32 50 57 38 b). What type of error is possible and describe this error in terms of the problem.arrow_forwardA new statistics book has been written and a faculty member and a student are asked to rank the new book and the other five best statistics books. How much do the student and professor agree on their assessment of the books (1 being the favorite, 6 being the least)? Use the data below to answer the following question:arrow_forward
- The price drivers pay for gasoline often varies a great deal across regions throughout the United States. The following data show the price per gallon for regular gasoline for a random sample of gasoline service stations for three major brands of gasoline (Shell, BP, and Marathon) located in eleven metropolitan areas across the upper Midwest region (OhioGasPrices.com website, March 18, 2012). Click on the datafile logo to reference the data. DATA file Shell BP Metropolitan Area Marathon Akron, Ohio Cincinnati, Ohio Cleveland, Ohio Columbus, Ohio Ft. Wayne, Indiana Indianapolis, Indiana Lansing, Michigan Lexington, Kentucky Louisville, Kentucky Muncie, Indiana Toledo, Ohio 3.77 3.72 3.87 3.76 3.78 3.87 3.89 3.79 3.83 3.83 3.85 3.77 3.83 3.85 3.93 3.84 3.84 4.04 3.87 3.87 3.99 3.79 3.78 3.81 3.69 3.78 3.84 3.84 3.83 3.79 3.79 3.86 3.86 Use a = .05 to test for any significant difference in the mean price of gasoline for the three brands. Round SS to 6 decimals, MS to 6 decimals, F to 2…arrow_forwardVirginia polled a large sample of individuals to find the percentage of students with known food allergies and the percentage of students without known food allergies. Which of the following could sufficiently display the data if only the two given categories are to be included? Select the correct answer below: bar graph pie chart either a pie chart or a bar graph neither a pie chart nor a bar grapharrow_forwardA survey of 800 college seniors resulted in the following crosstabulation regarding their undergraduate major and whether or not they plan to go to graduate school. What does the crosstabulation show? frequencies column percentages relative frequencies Orow percentages O overall percentages Undergraduate Major Graduate School Business Engineering Others Total 126 280 Yes No Total 70 182 252 84 208 292 TO 130 256 520 800arrow_forward
arrow_back_ios
SEE MORE QUESTIONS
arrow_forward_ios
Recommended textbooks for you
- MATLAB: An Introduction with ApplicationsStatisticsISBN:9781119256830Author:Amos GilatPublisher:John Wiley & Sons Inc
 Probability and Statistics for Engineering and th...StatisticsISBN:9781305251809Author:Jay L. DevorePublisher:Cengage Learning
 Statistics for The Behavioral Sciences (MindTap C...StatisticsISBN:9781305504912Author:Frederick J Gravetter, Larry B. WallnauPublisher:Cengage Learning
  Elementary Statistics: Picturing the World (7th E...StatisticsISBN:9780134683416Author:Ron Larson, Betsy FarberPublisher:PEARSON
 The Basic Practice of StatisticsStatisticsISBN:9781319042578Author:David S. Moore, William I. Notz, Michael A. FlignerPublisher:W. H. Freeman
 Introduction to the Practice of StatisticsStatisticsISBN:9781319013387Author:David S. Moore, George P. McCabe, Bruce A. CraigPublisher:W. H. Freeman
MATLAB: An Introduction with Applications
Statistics
ISBN:9781119256830
Author:Amos Gilat
Publisher:John Wiley & Sons Inc
Probability and Statistics for Engineering and th...
Statistics
ISBN:9781305251809
Author:Jay L. Devore
Publisher:Cengage Learning
Statistics for The Behavioral Sciences (MindTap C...
Statistics
ISBN:9781305504912
Author:Frederick J Gravetter, Larry B. Wallnau
Publisher:Cengage Learning
Elementary Statistics: Picturing the World (7th E...
Statistics
ISBN:9780134683416
Author:Ron Larson, Betsy Farber
Publisher:PEARSON
The Basic Practice of Statistics
Statistics
ISBN:9781319042578
Author:David S. Moore, William I. Notz, Michael A. Fligner
Publisher:W. H. Freeman
Introduction to the Practice of Statistics
Statistics
ISBN:9781319013387
Author:David S. Moore, George P. McCabe, Bruce A. Craig
Publisher:W. H. Freeman