
MATLAB: An Introduction with Applications
6th Edition
ISBN: 9781119256830
Author: Amos Gilat
Publisher: John Wiley & Sons Inc
expand_more
expand_more
format_list_bulleted
Related questions
Concept explainers
Question
thumb_up100%
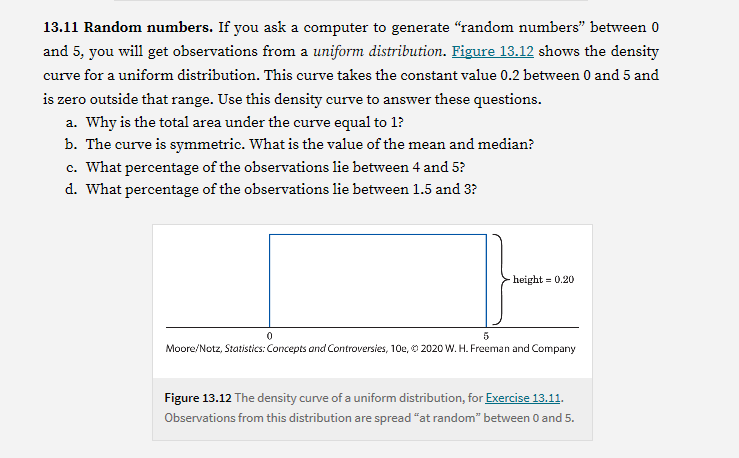

Transcribed Image Text:13.11 Random numbers. If you ask a computer to generate “random numbers" between 0
and 5, you will get observations from a uniform distribution. Figure 13.12 shows the density
curve for a uniform distribution. This curve takes the constant value 0.2 between 0 and 5 and
is zero outside that range. Use this density curve to answer these questions.
a. Why is the total area under the curve equal to 1?
b. The curve is symmetric. What is the value of the mean and median?
c. What percentage of the observations lie between 4 and 5?
d. What percentage of the observations lie between 1.5 and 3?
height = 0,20
Moore/Notz, Statistics: Concepts and Controversies, 10e, 0 2020 W. H. Freeman and Company
Figure 13.12 The density curve of a uniform distribution, for Exercise 13.11.
Observations from this distribution are spread "at random" between 0 and 5.

Transcribed Image Text:IQ test scores. Figure 13.13 is a stemplot of the IQ scores that are consistent with the 2018
article "Flynn effect and its reversal are both environmentally caused." This distribution is
very close to Normal with mean 100 and standard deviation 10. Use the Normal distribution
with mean 100 and standard deviation 10 as a description of the IQ test scores of all adults.
Use this distribution and the 68-95–99.7 rule to answer Exercises 13.12 to 13.14.
8 | 24
8 6778999
9 00012224
555
677888888999
10
000001111122344
10
555556667788899
11
11
02233
55668
12 | 234
Moore/Notz, Statistics: Concepts and
Controversies, 10e, © 2020 W. H.
Freeman and Company
Figure 13.13 Stemplot of the IQ scores of 80 adults, for
Exercises 13.12 to 13.14. (Key: A stem of 8 and a leaf of 2
means 82.)
13.14 What percentage of all students have IQ scores below 80? None of the 80 adults in our
sample had scores this low. Are you surprised at this? Why?
Expert Solution
This question has been solved!
Explore an expertly crafted, step-by-step solution for a thorough understanding of key concepts.

This is a popular solution

Trending nowThis is a popular solution!

Step by stepSolved in 5 steps with 5 images

Knowledge Booster


Learn more about
Need a deep-dive on the concept behind this application? Look no further. Learn more about this topic, statistics and related others by exploring similar questions and additional content below.Similar questions
- Find X1.05 for x² distribution with 10 degrees of freedom. = X0.05 (Round the answer to 3 decimal places)arrow_forwardPost your created histogram. How would you describe the distribution? (Symmetric, skew left, skew right? Is it unimodal or bimodal?) Picture is below .arrow_forwardSuppose x has a normal distribution with mean ? = 26 and standard deviation ? = 7.Describe the distribution of x values for sample size n = 4. (Round ?x to two decimal places.) ?x = ?x = Describe the distribution of x values for sample size n = 16. (Round ?x to two decimal places.) ?x = ?x = Describe the distribution of x values for sample size n = 100. (Round ?x to two decimal places.) ?x = ?x = How do the x distributions compare for the various samples sizes? The standard deviations are the same, but the means are decreasing with increasing sample size.The standard deviations are the same, but the means are increasing with increasing sample size. The means are the same, but the standard deviations are decreasing with increasing sample size.The means are the same, but the standard deviations are increasing with increasing sample size.The means and standard deviations are the same regardless of sample size.arrow_forward
- please answer Question d)arrow_forwardSuppose x has a normal distribution with mean ? = 53 and standard deviation ? = 7.Describe the distribution of x values for sample size n = 4. (Round ?x to two decimal places.) ?x = ?x = Describe the distribution of x values for sample size n = 16. (Round ?x to two decimal places.) ?x = ?x = Describe the distribution of x values for sample size n = 100. (Round ?x to two decimal places.) ?x = ?x =arrow_forwardPlease help thank youarrow_forward
- Use the mean and standard deviation formula for a Uniform Distribution for our population distribution. Take the mean and standard deviation from your population distribution to find the mean and standard error of your sampling distribution. Don’t forget to label your axes and do not forget to write out your calculator command. Don’t forget the units on your percentile. Every statistic has the same units as your variable. All this information that is above goes with the image attached Please please answer everything please at least try to answer everything please I would really appreciate it thank youarrow_forwardPLEASE ANSWER ALL THE PARTS OF THE QUESTION (THIS IS NOT A GRADED ASSIGNMENT) 1. Suppose the distribution of cholesterol levels in a population of men is approximately normally distributed with a mean of 200 mg/dL and a standard deviation of 32 mg/dL. A. What is the standard deviation of the sampling distribution of ˉxˉ for n=25? Write your answer as a decimal value rounded to four decimal places. B. What condition allows us to say that the value in part (A) is approximately true? C. What is the shape of the sampling distribution of ˉxˉ for n=25? D. What condition allows us to answer as we did in part (C)? E. You take a random sample of 25 males from this population and find the average level of the sample to be 188 mg/dL. How unusual is this sample? Show your work (conditions, mechanics, and context)arrow_forwardcan you help me with this question also A, b and c pleasearrow_forward
arrow_back_ios
arrow_forward_ios
Recommended textbooks for you
- MATLAB: An Introduction with ApplicationsStatisticsISBN:9781119256830Author:Amos GilatPublisher:John Wiley & Sons Inc
 Probability and Statistics for Engineering and th...StatisticsISBN:9781305251809Author:Jay L. DevorePublisher:Cengage Learning
 Statistics for The Behavioral Sciences (MindTap C...StatisticsISBN:9781305504912Author:Frederick J Gravetter, Larry B. WallnauPublisher:Cengage Learning
  Elementary Statistics: Picturing the World (7th E...StatisticsISBN:9780134683416Author:Ron Larson, Betsy FarberPublisher:PEARSON
 The Basic Practice of StatisticsStatisticsISBN:9781319042578Author:David S. Moore, William I. Notz, Michael A. FlignerPublisher:W. H. Freeman
 Introduction to the Practice of StatisticsStatisticsISBN:9781319013387Author:David S. Moore, George P. McCabe, Bruce A. CraigPublisher:W. H. Freeman
MATLAB: An Introduction with Applications
Statistics
ISBN:9781119256830
Author:Amos Gilat
Publisher:John Wiley & Sons Inc
Probability and Statistics for Engineering and th...
Statistics
ISBN:9781305251809
Author:Jay L. Devore
Publisher:Cengage Learning
Statistics for The Behavioral Sciences (MindTap C...
Statistics
ISBN:9781305504912
Author:Frederick J Gravetter, Larry B. Wallnau
Publisher:Cengage Learning
Elementary Statistics: Picturing the World (7th E...
Statistics
ISBN:9780134683416
Author:Ron Larson, Betsy Farber
Publisher:PEARSON
The Basic Practice of Statistics
Statistics
ISBN:9781319042578
Author:David S. Moore, William I. Notz, Michael A. Fligner
Publisher:W. H. Freeman
Introduction to the Practice of Statistics
Statistics
ISBN:9781319013387
Author:David S. Moore, George P. McCabe, Bruce A. Craig
Publisher:W. H. Freeman