
MATLAB: An Introduction with Applications
6th Edition
ISBN: 9781119256830
Author: Amos Gilat
Publisher: John Wiley & Sons Inc
expand_more
expand_more
format_list_bulleted
Related questions
Question
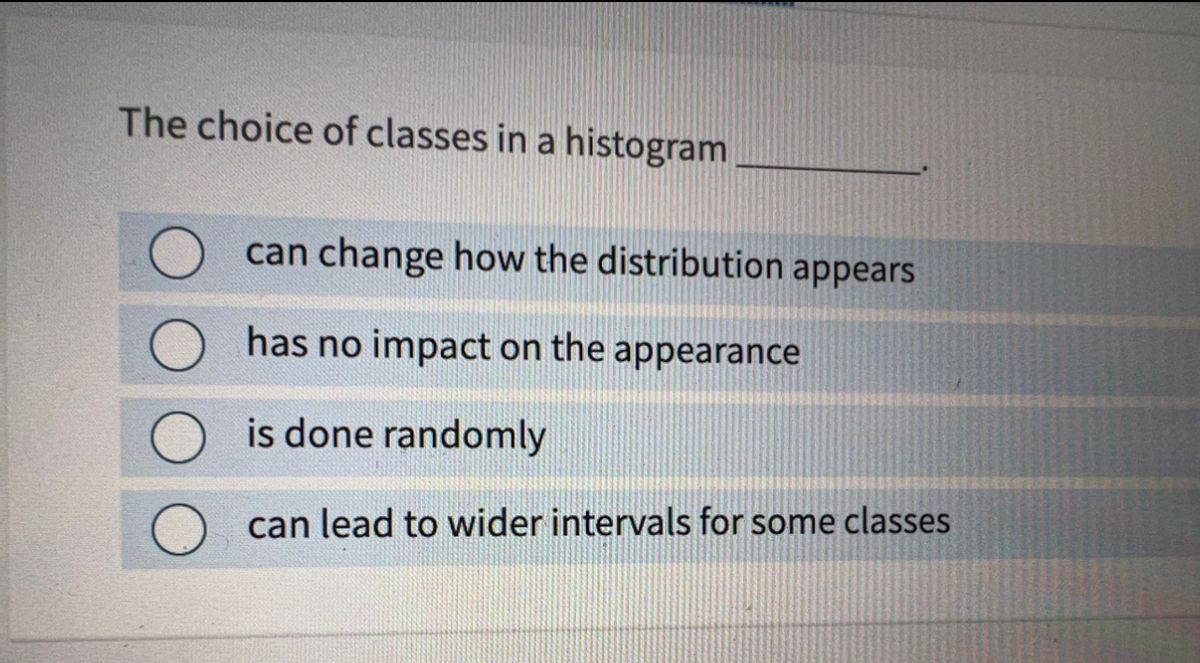

Transcribed Image Text:The choice of classes in a histogram
can change how the distribution appears
has no impact on the appearance
is done randomly
can lead to wider intervals for some classes
Expert Solution
This question has been solved!
Explore an expertly crafted, step-by-step solution for a thorough understanding of key concepts.

This is a popular solution

Trending nowThis is a popular solution!

Step by stepSolved in 2 steps

Knowledge Booster

Similar questions
- Describe the range of values for the correlation coefficient.arrow_forwardwhat does it means that the variable are positively correlated?arrow_forwardIn a sample of employees at a company here were the number of days they were out (sick/personal/vacation days) last year: 1, 6, 19, 35, 5, 9, 8, 12, 2, 15, 7, 7, 11, 15, 0, 25, 20, 15, 19, 5 Using Minitab, find the following sample statistics (take a screenshot of your output from Minitab and paste it here): Mean = median = Standard deviation =IQR=arrow_forward
- Researchers were interested in assessing whether stress levels are different at the beginning of the semester compared to finals week. To test this, stress was measured in 5 students at the start of the semester and then again at the end of the semester during finals week. Participant Stress 1 Stress 2 Difference Score (Di) (Di - Mdiff)2 1 22 22 0 2 32 34 -2 3 24 25 -1 4 28 30 -2 5 26 29 -3 What is the SS of the mean differences (i.e., Σ(Di - Mdiff)2)? Round to 2 decimal places.arrow_forwardWhat are some of the most basic statistic formulas used in excel for the Hospitality carrier field?arrow_forwarddraw a histogram that is symmetric but not mound-shapedarrow_forward
- What effect does an outlier have on a correlation coefficient? Would it increase, decrease or stay the same?arrow_forwardDefine Test a correlation for significance?arrow_forwardWrite up your results as you would see them in a research paper. Be sure that you include the means and standard deviations for each group in your write-up, as well as a sentence or two explaining the resultsarrow_forward
arrow_back_ios
arrow_forward_ios
Recommended textbooks for you
- MATLAB: An Introduction with ApplicationsStatisticsISBN:9781119256830Author:Amos GilatPublisher:John Wiley & Sons Inc
 Probability and Statistics for Engineering and th...StatisticsISBN:9781305251809Author:Jay L. DevorePublisher:Cengage Learning
 Statistics for The Behavioral Sciences (MindTap C...StatisticsISBN:9781305504912Author:Frederick J Gravetter, Larry B. WallnauPublisher:Cengage Learning
  Elementary Statistics: Picturing the World (7th E...StatisticsISBN:9780134683416Author:Ron Larson, Betsy FarberPublisher:PEARSON
 The Basic Practice of StatisticsStatisticsISBN:9781319042578Author:David S. Moore, William I. Notz, Michael A. FlignerPublisher:W. H. Freeman
 Introduction to the Practice of StatisticsStatisticsISBN:9781319013387Author:David S. Moore, George P. McCabe, Bruce A. CraigPublisher:W. H. Freeman
MATLAB: An Introduction with Applications
Statistics
ISBN:9781119256830
Author:Amos Gilat
Publisher:John Wiley & Sons Inc
Probability and Statistics for Engineering and th...
Statistics
ISBN:9781305251809
Author:Jay L. Devore
Publisher:Cengage Learning
Statistics for The Behavioral Sciences (MindTap C...
Statistics
ISBN:9781305504912
Author:Frederick J Gravetter, Larry B. Wallnau
Publisher:Cengage Learning
Elementary Statistics: Picturing the World (7th E...
Statistics
ISBN:9780134683416
Author:Ron Larson, Betsy Farber
Publisher:PEARSON
The Basic Practice of Statistics
Statistics
ISBN:9781319042578
Author:David S. Moore, William I. Notz, Michael A. Fligner
Publisher:W. H. Freeman
Introduction to the Practice of Statistics
Statistics
ISBN:9781319013387
Author:David S. Moore, George P. McCabe, Bruce A. Craig
Publisher:W. H. Freeman