
MATLAB: An Introduction with Applications
6th Edition
ISBN: 9781119256830
Author: Amos Gilat
Publisher: John Wiley & Sons Inc
expand_more
expand_more
format_list_bulleted
Related questions
Concept explainers
Topic Video
Question
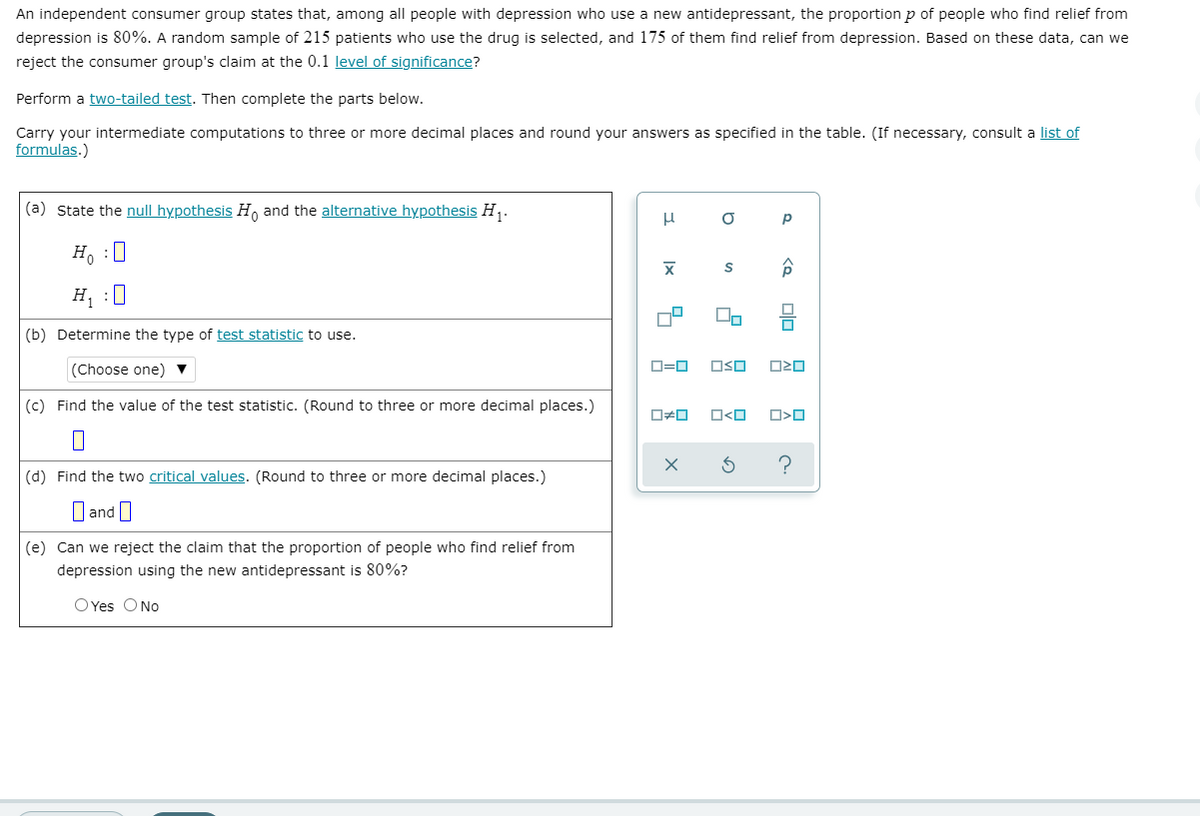

Transcribed Image Text:An independent consumer group states that, among all people with depression who use a new antidepressant, the proportion p of people who find relief from
depression is 80%. A random sample of 215 patients who use the drug is selected, and 175 of them find relief from depression. Based on these data, can we
reject the consumer group's claim at the 0.1 level of significance?
Perform a two-tailed test. Then complete the parts below.
Carry your intermediate computations to three or more decimal places and round your answers as specified in the table. (If necessary, consult a list of
formulas.)
(a) State the null hypothesis H, and the alternative hypothesis H,.
H :0
H :U
On
(b) Determine the type of test statistic to use.
(Choose one) ▼
OSO
(c) Find the value of the test statistic. (Round to three or more decimal places.)
O<O
(d) Find the two critical values. (Round to three or more decimal places.)
Iand
(e) Can we reject the claim that the proportion of people who find relief from
depression using the new antidepressant is 80%?
O Yes ONo
to
Expert Solution
This question has been solved!
Explore an expertly crafted, step-by-step solution for a thorough understanding of key concepts.

Step by stepSolved in 2 steps with 1 images

Knowledge Booster


Learn more about
Need a deep-dive on the concept behind this application? Look no further. Learn more about this topic, statistics and related others by exploring similar questions and additional content below.Similar questions
- 16% of all Americans suffer from sleep apnea. A researcher suspects that a different percentage of those who live in the inner city have sleep apnea. Of the 337 people from the inner city surveyed, 47 of them suffered from sleep apnea. What can be concluded at the level of significance of α= 0.05? a. The test statistic= (please show your answer to 3 decimal places.) b. The p-value = (Please show your answer to 4 decimal places.)arrow_forwardA researcher surveyed 12 men who lost their fathers earlier in their lives. His survey included the age of the subjects when their fathers died and their confidence that they would someday be happily married themselves (100 point scale – higher score = more confidence). The results are shown below. Mx=15 My =60 SSx=348 SSy=5198 SPxy=933 Age Confidence Rating 12 34 8 30 11 89 21 69 15 55 7 38 18 78 23 66 22 89 19 79 9 35 15 58 Can you estimate a confidence rating for a man who lost his father at 30 years old? Why or why not?arrow_forwardA researcher surveyed 12 men who lost their fathers earlier in their lives. His survey included the age of the subjects when their fathers died and their confidence that they would someday be happily married themselves (100 point scale – higher score = more confidence). The results are shown below. Mx=15 My =60 SSx=348 SSy=5198 SPxy=933 Age Confidence Rating 12 34 8 30 11 89 21 69 15 55 7 38 18 78 23 66 22 89 19 79 9 35 15 58 The effect size is equal to _____________ . This means it is a ______________ effect.arrow_forward
- In 1995, it was determined that 78% of US citizens supported a ban on household aerosols. Thinking that this proportion may have changed over the past few decades, a sample will be taken to test if a change has occurred. In a SRS of 400 citizens taken this year, 332 supported the ban. Determine the value of the appropriate test statistic to perform this test. Round to 3 decimal places.arrow_forwardYou may need to use the appropriate appendix table or technology to answer this question. Of 290 female registered voters surveyed, 119 indicated they were planning to vote for the incumbent president. Of 425 male registered voters, 157 indicated they were planning to vote for the incumbent president. (a) Compute the test statistic. (Use female male. Round your answer to three decimal places.) (b) At a = 0.01, test to see if there is a significant difference between the population proportions of females and males who plan to vote for the incumbent president. (Use the p-value approach.) Calculate the p-value. (Round your answer to three decimal places.) p-value = What is your conclusion? O Do not reject Ho. We can conclude that there is a significant difference between the two poplation proportions. O Do not reject Ho. We cannot conclude that there is a significant difference between the two population proportions. O Reject Ho. We cannot conclude that there is a significant difference…arrow_forwardA publisher reports that 69 % of their readers own a particular make of car. A marketing executive wants to test the claim that the percentage is actually under the reported percentage. A random sample of 200 found that 60% of the readers owned a particular make of car. Is there sufficient evidence at the 0.10 level to support the executive's claim? Step 4 of 7: Determine the P-value of the test statistic. Round your answer to four decimal places.arrow_forward
- The next six questions refer to the following scenario: A random sample of 25 students were asked to self-identify as "statistics-lovers" or "statistics-adorers." 16 students self-identified as "lovers" and 9 students as "adorers." Below table summarizes the mean of a statistics test and standard deviation that was given after the self-identification. Test the following hypothesis at alpha=5% (0.05). HO: Mean Statistics Lovers = Mean Statistics Adorers HA: Mean Statistics Lovers Mean Statistics Adorers You can assume equal variance.arrow_forwardOn average, a sample of n = 36 scores will provide a better estimate of the population mean than a sample of n = 49 scores from the same population.arrow_forwardWhat is the answer of the 7.14 question?arrow_forward
- Answer the following to summarize the test of the hypothesis that there is no dependence between the two variables color vision of participant and trial outcome. For your test, use the 0.05 level of significance. a. Find the value of the test statistic. (Round to two or more decimal places.) b. Find the critical value for a test at the 0.05 level of significance. (Round to two or more decimal places.) c. Can we reject the hypothesis that there is no dependence between the variables color vision of participant and trial outcome? Use the 0.05 level of significance.arrow_forwardWrite up your results as you would see them in a research paper. Be sure that you include the means and standard deviations for each group in your write-up, as well as a sentence or two explaining the resultsarrow_forward
arrow_back_ios
arrow_forward_ios
Recommended textbooks for you
- MATLAB: An Introduction with ApplicationsStatisticsISBN:9781119256830Author:Amos GilatPublisher:John Wiley & Sons Inc
 Probability and Statistics for Engineering and th...StatisticsISBN:9781305251809Author:Jay L. DevorePublisher:Cengage Learning
 Statistics for The Behavioral Sciences (MindTap C...StatisticsISBN:9781305504912Author:Frederick J Gravetter, Larry B. WallnauPublisher:Cengage Learning
  Elementary Statistics: Picturing the World (7th E...StatisticsISBN:9780134683416Author:Ron Larson, Betsy FarberPublisher:PEARSON
 The Basic Practice of StatisticsStatisticsISBN:9781319042578Author:David S. Moore, William I. Notz, Michael A. FlignerPublisher:W. H. Freeman
 Introduction to the Practice of StatisticsStatisticsISBN:9781319013387Author:David S. Moore, George P. McCabe, Bruce A. CraigPublisher:W. H. Freeman
MATLAB: An Introduction with Applications
Statistics
ISBN:9781119256830
Author:Amos Gilat
Publisher:John Wiley & Sons Inc
Probability and Statistics for Engineering and th...
Statistics
ISBN:9781305251809
Author:Jay L. Devore
Publisher:Cengage Learning
Statistics for The Behavioral Sciences (MindTap C...
Statistics
ISBN:9781305504912
Author:Frederick J Gravetter, Larry B. Wallnau
Publisher:Cengage Learning
Elementary Statistics: Picturing the World (7th E...
Statistics
ISBN:9780134683416
Author:Ron Larson, Betsy Farber
Publisher:PEARSON
The Basic Practice of Statistics
Statistics
ISBN:9781319042578
Author:David S. Moore, William I. Notz, Michael A. Fligner
Publisher:W. H. Freeman
Introduction to the Practice of Statistics
Statistics
ISBN:9781319013387
Author:David S. Moore, George P. McCabe, Bruce A. Craig
Publisher:W. H. Freeman