
MATLAB: An Introduction with Applications
6th Edition
ISBN: 9781119256830
Author: Amos Gilat
Publisher: John Wiley & Sons Inc
expand_more
expand_more
format_list_bulleted
Related questions
Question

Transcribed Image Text:A
B
2494
1
2465
1
2693
1
2499
1
2365
1
2556
1
2498
1
4477
2
4182
4485
4283
4131
4076
4297
4481
8861
8739
9638
9084
9272
8904
9579
8479
10213
10281
J~~~~~~~MMMMMMMMVV
2
2
2
2
2
2
2
3
3
3
3
3
3
3
3
4
4
11138
4
11560
4
10479
4
10468
4
11151
11015
C
U-~~M344--~~MM11--2233441-2233447-22334417223344
20601
22996
23797
23625
22106
20773
20884
22430
145555555566666666
35985
40224
42457
41064
39140
37987
39049
37204

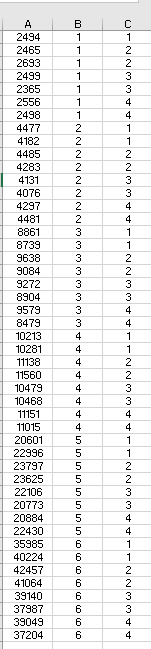
Transcribed Image Text:An experiment was performed to compare the lumen measurements obtained by four pho-
tometry labs. A collection of six lamps was prepared and circulated to each of the labs.
Each lab measured each lamp twice and measurements were made in completely random
order. Analyze the data and interpret the results. Construct an appropriate error statement
for this data set.
Lab
A
B
C
D
#71522
2409, 2494
2465, 2693
2499, 2365
2556, 2498
#71533
4477, 4182
4485, 4283
4131, 4076
4297, 4481
Lamp #71534
8861, 8739
9638, 9084
9272, 8904
9579, 8479
#71535 10213, 10281
#71536 20601, 22996
11138, 11560
10479, 10468
11151, 11015
23797, 23625
22106, 20773
20884, 22430
#71537 35985, 40224
42457, 41064
39140, 37987
39049, 37204
Expert Solution
This question has been solved!
Explore an expertly crafted, step-by-step solution for a thorough understanding of key concepts.

Step by stepSolved in 2 steps

Knowledge Booster

Similar questions
- Please give the excel formula or spreadsheet.arrow_forwardWeight City MPG 3968 20 3583 22 3470 22 3527 23 3990 18 4724 17 3692 21 3315 22 3616 20 5527 14 3719 16 3097 26 3800 19 3532 25 2269 31 5674 15 3402 20 4029 19 3996 19 3242 23 2434 31 2575 29 2960 27 3618 15 4054 19 3192 24 3305 23 3605 19 4240 15 3933 18 3633 19 3790 17 3477 20 3258 21 4685 17 2776 25 2615 24 3186 21 5137 13 3461 21 4233 16 4178 18 4702 17 3713 22 5794 14 2306 28 3194 26 3428 22 4894 12 4751 17 2605 29 3296 25 5267 13 2789 25 3570 19 4011 18 2363 27 4398 15 2806 25 2127 36 2665 27 3419 24 3427 24 3280 25 5765 13 3465 24 2295 30 3038 22 3070 25 4711 17 3230 24 3528 21 4667 16 SUMMARY OUTPUT Regression Statistics Multiple R 0.894328844 R Square 0.799824082 Adjusted R Square 0.797004703 Standard Error 2.238112689…arrow_forward3) Draw a Frequency Polygon, label clearly. You must label both axes numerically, name the vertical axis, name the horizontal axis, and draw the graph appropriately. Number of Touchdown Passes in the 2020 Season for The Top 20 Quarterbacks in the NFL 15-19 - 20-24- 25-29 30-34 - 35-39 - 40-44 45-49arrow_forward
- How long does it take to finish the 1161-mile Iditarod Dog Sled Race from Anchorage to Nome, Alaska? Finish times (to the nearest hour) for 57 dogsled teams are shown below. 261 271 236 244 279 296 284 299 288 288 247 256 338 360 341 333 261 266 287 296 313 311 307 307 299 303 277 283 304 305 288 290 288 289 297 299 332 330 309 328 307 328 285 291 295 298 306 315 310 318 318 320 333 321 323 324 327 For this problem, use five classes. (a) Find the class width. (b) Make a frequency table showing class limits, class boundaries, midpoints, frequencies, relative frequencies, and cumulative frequencies. (Give relative frequencies to 2 decimal places.)arrow_forwardSolve the attached question and round as needed in each part pleasearrow_forwardCMP 112 Summary and Homework for September 15th (1) - Last saved by user -. O Search Joselyn Arreguin JA Design Layout References Mailings Review View Help Table Design Layout 8 Share O Find v (Body) v 1 - A A Aa - Ao 三、三、i、 刷处T AaBbCcDd AaBbCcDd AaBbC AABBCCC AaB AaBbCcD O Replace 目===三。 1 Normal 1 No Spac. Heading 1 Heading 2 Sensitivity Dictate Editor U v ab X, x A D. A - 田。 Title Subtitle A Select Font Paragraph Styles Editing Voice Sensitivity Editor 4) A weighted mean considers the weight of a particular value. For example, an A in a five credit Calculus course contributes more to someone's GPA than the C they earned in a one credit underwater basket weaving course. Below are the grades received by one student. Assuming an A is worth 4 points, B is worth 3 points and a C is worth 2 points, calculate this student's GPA. Show work. Hint: In class, I demonstrated what to do if a data value occurs more than once. 田 Class Grade Earned Credits Calculus A 3 English Psychology Underwater…arrow_forward
- The table below shows the number of individuals infected with a disease t days after its first detected by the CDC. Days Infected Individuals 1 2 678 722 3 756 4 825 5 7 6 882 945 1017 8 1104arrow_forwardQu The table provided below shows paired data for the heights of a certain country's presidents and their main opponents in the election campaign. Construct a scatterplot. Does there appear to be a correlation? Click the icon to view the data table for election heights. Construct a scatterplot. Choose the correct graph below. O A. OC. 200- 200- 200- 200- 160+ 160 President's height 160+ 160 President's height 160+ 160 President's height 160+ 160 President's height 200 200 200 200 Does there appear to be a correlation between the president's height and his opponent's height? A. Yes, there appears to be a correlation. As the president's height increases, his opponent's height decreases. B. Yes, there appears to be a correlation. The candidate with the highest height usually wins. C. Yes, there appears to be a correlation. As the president's height increases, his opponent's height increases. D. No, there does not appear to be a correlation because there is no general pattern to the data.…arrow_forward1040 1040 1290 1035 1050 960 745 770 1400 1080 845 1130 1025 1090 830 1075 810 1045 1015 970 1135 1160 1595 1365 825 1405 1230 1485 1015 715 1035 825 1190 1175 950 1305 1335 1725 1515 895 810 1135 1580 1130 1340 655 960 1265 860 875 940 1535 930 1480 1280 1055 1405 1220 1090 1410 1115 1010 1135 1135 1050 1205 1100 1290 1345 1170 1225 925 1255 1650 1000 890 1200 980 1005 1525 1165 1335 1175 1755 1035 1125 920 1150 1300 955 1075 1195 1475 1085 990 1295 835 1065 1405 1075 9 Currently 200 students are taking E270. Suppose each student is assigned to take a random sample of 100 two-bedroom aprtments in Indianapolis Metropolitan Area (IMA) and each build a 95% confidence interval for the average monthly rent for two-bedroom apartments. How many of the 200 interval estimated submitted by students do you expect to capture the population mean monthly rent? a 195 b 190 c 185 d 95arrow_forward
arrow_back_ios
arrow_forward_ios
Recommended textbooks for you
- MATLAB: An Introduction with ApplicationsStatisticsISBN:9781119256830Author:Amos GilatPublisher:John Wiley & Sons Inc
 Probability and Statistics for Engineering and th...StatisticsISBN:9781305251809Author:Jay L. DevorePublisher:Cengage Learning
 Statistics for The Behavioral Sciences (MindTap C...StatisticsISBN:9781305504912Author:Frederick J Gravetter, Larry B. WallnauPublisher:Cengage Learning
  Elementary Statistics: Picturing the World (7th E...StatisticsISBN:9780134683416Author:Ron Larson, Betsy FarberPublisher:PEARSON
 The Basic Practice of StatisticsStatisticsISBN:9781319042578Author:David S. Moore, William I. Notz, Michael A. FlignerPublisher:W. H. Freeman
 Introduction to the Practice of StatisticsStatisticsISBN:9781319013387Author:David S. Moore, George P. McCabe, Bruce A. CraigPublisher:W. H. Freeman
MATLAB: An Introduction with Applications
Statistics
ISBN:9781119256830
Author:Amos Gilat
Publisher:John Wiley & Sons Inc
Probability and Statistics for Engineering and th...
Statistics
ISBN:9781305251809
Author:Jay L. Devore
Publisher:Cengage Learning
Statistics for The Behavioral Sciences (MindTap C...
Statistics
ISBN:9781305504912
Author:Frederick J Gravetter, Larry B. Wallnau
Publisher:Cengage Learning
Elementary Statistics: Picturing the World (7th E...
Statistics
ISBN:9780134683416
Author:Ron Larson, Betsy Farber
Publisher:PEARSON
The Basic Practice of Statistics
Statistics
ISBN:9781319042578
Author:David S. Moore, William I. Notz, Michael A. Fligner
Publisher:W. H. Freeman
Introduction to the Practice of Statistics
Statistics
ISBN:9781319013387
Author:David S. Moore, George P. McCabe, Bruce A. Craig
Publisher:W. H. Freeman