
MATLAB: An Introduction with Applications
6th Edition
ISBN: 9781119256830
Author: Amos Gilat
Publisher: John Wiley & Sons Inc
expand_more
expand_more
format_list_bulleted
Related questions
Concept explainers
Topic Video
Question
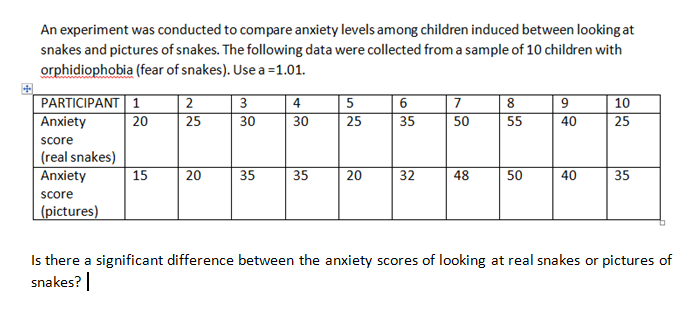

Transcribed Image Text:An experiment was conducted to compare anxiety levels among children induced between looking at
snakes and pictures of snakes. The following data were collected from a sample of 10 children with
orphidiophobia (fear of snakes). Use a =1.01.
PARTICIPANT 1
Anxiety
4
10
5
25
6
7
8
20
25
30
30
35
50
55
40
25
score
(real snakes)
Anxiety
15
20
35
35
20
32
48
50
40
35
Score
(pictures)
Is there a significant difference between the anxiety scores of looking at real snakes or pictures of
snakes? |
Expert Solution
This question has been solved!
Explore an expertly crafted, step-by-step solution for a thorough understanding of key concepts.

This is a popular solution

Trending nowThis is a popular solution!

Step by stepSolved in 2 steps with 13 images

Knowledge Booster


Learn more about
Need a deep-dive on the concept behind this application? Look no further. Learn more about this topic, statistics and related others by exploring similar questions and additional content below.Similar questions
- Listed below are the lead concentrations in different Ayurveda medicines. Ayurveda is a traditional medical system commonly used in India. The lead concentrations listed here are from medicines manufactured in the United States. Use a significance level to test the claim that the mean lead concentration for all such medicines is less than 14. 3.0,6.5,6.0,5.5,20.5,7.5,12.0,20.5,11.5,17.5arrow_forwardIs the proportion of wildfires caused by humans in the south higher than the proportion of wildfires caused by humans in the west? 348 of the 574 randomly selected wildfires looked at in the south were caused by humans while 272 of the 518 randomly selected wildfires looked at the west were caused by humans. What can be concluded at the = 0.01 level of significance? a. For this study, we should use Select an answer b. The null and alternative hypotheses would be: Ho: Select an answer Select an answer Select an answer (please enter a decimal) H₁: Select an answer Select an answer Select an answer (Please enter a decimal) = c. The test statistic ? ◊ your answer to 3 decimal places.) (please showarrow_forwardA credit score is used by credit agencies (such as mortgage companies and banks) to assess the creditworthiness of individuals. Values range from 300 to 850, with a credit score over 700 considered to be a quality credit risk. According to a survey, the mean credit score is 708.2. A credit analyst wondered whether high-income individuals (incomes in excess of $100,000 per year) had higher credit scores. He obtained a random sample of 31 high-income individuals and found the sample mean credit score to be 723.3 with a standard deviation of 80.9. Conduct the appropriate test to determine if high-income individuals have higher credit scores at the α = 0.05 level of significance. C State the null and alternative hypotheses. Ho: HY H₁: (Type integers or decimals. Do not round.) Identify the t-statistic. to = (Round to two decimal places as needed.) Identify the P-value. P-value = (Round to three decimal places as needed.) Make a conclusion regarding the hypothesis. the null hypothesis.…arrow_forward
- A credit score is used by credit agencies (such as mortgage companies and banks) to assess the creditworthiness of individuals. Values range from 300 to 850, with a credit score over 700 considered to be a quality credit risk. According to a survey, the mean credit score is 704.5. A credit analyst wondered whether high-income individuals (incomes in excess of $100,000 per year) had higher credit scores. He obtained a random sample of 36 high-income individuals and found the sample mean credit score to be 714.9 with a standard deviation of 81.7. Conduct the appropriate test to determine if high-income individuals have higher credit scores at the a = 0.05 level of significance. State the null and alternative hypotheses. Ho: H V H1: H V (Type integers or decimals. Do not round.) Identify the t-statistic. to (Round to two decimal places as needed.) Identify the P-value. P-value = (Round to three decimal places as needed.) Make a conclusion regarding the hypothesis. V the null hypothesis.…arrow_forwardA study was conducted to determine the proportion of people who dream in black and white instead of color. Among 285 people over the age of 55, 68 dream in black and white, and among 307 people under the age of 25, 14 dream in black and white. Use a 0.01 significance level to test the claim that the proportion of people over 55 who dream in black and white is greater than the proportion for those under 25. An explanation for the results is that those over the age of 55 grew up exposed to media that was displayed in black and white. Can these results be used to verify that explanation? OA. No. The results speak to a possible difference between the proportions of people over 55 and under 25 who dream in black and white, but the results cannot be used to verify the cause of such a difference. OB. No. The results speak to a possible difference between the proportions of people over 55 and under 25 who dream in black and white, but the results are not statistically significant enough to…arrow_forwardOne personality test available on the World Wide Web has a subsection designed to assess the "honesty" of the test-taker. After taking the test and seeing your score for this subsection, you're interested in the mean score, µ, among the general population on this subsection. The website reports that µ is 142, but you believe that u is less than 142. You decide to do a statistical test. You choose a random sample of people and have them take the personality test. You find that their mean score on the subsection is 135 and that the standard deviation of their scores is 28. Based on this information, answer the questions below. What are the null hypothesis (H) and the alternative hypothesis (H,) that should be used for the test? Ho: u is ? ? |H,: µ is ? H : ? In the context of this test, what is a Type II error? A Type II error is ? v the hypothesis that u is ? v when, in fact, μ is| ? ? Suppose that you decide not to reject the null hypothesis. What sort of error might you be making? ?arrow_forward
- Please help me with the following question and make sure your answer is correct 100%, thank youarrow_forwardA study was conducted to determine the proportion of people who dream in black and white instead of color. Among 295 people over the age of 55, 64 dream in black and white, and among 312 people under the age of 25, 13 dream in black and white. Use a 0.05 significance level to test the claim that the proportion of people over 55 who dream in black and white is greater than the proportion for those under 25. Complete parts (a) through (c) below. a. Test the claim using a hypothesis test. Consider the first sample to be the sample of people over the age of 55 and the second sample to be the sample of people under the age of 25. What are the null and alternative hypotheses for the hypothesis test? O A. Ho: P₁ = P₂ H₁: P₁ P2 O B. Ho: P₁ P₂ H₁: P₁ = P2 O E. Ho: P₁ SP₂ H₁: P₁ P2 OC. Ho: P₁ P2 H₁: P₁ P2 OF. Ho: P₁ H₁: P₁ P₂ P2arrow_forwardA credit score is used by credit agencies (such as mortgage companies and banks) to assess the creditworthiness of individuals. Values range from 300 to 850, with a credit score over 700 considered to be a quality credit risk. According to a survey, the mean credit score is 702.4. A credit analyst wondered whether high-income individuals (incomes in excess of $100,000 per year) had higher credit scores. He obtained a random sample of 41 high-income individuals and found the sample mean credit score to be 721.3 with a standard deviation of 80.9. Conduct the appropriate test to determine if high-income individuals have higher credit scores at the a= 0.05 level of significance. State the null and alternative hypotheses. Ho H H₁ H (Type integers or decimals. Do not round.) Identify the t-statistic. to = (Round to two decimal places as needed.) Identify the P-value. P-value= (Round to three decimal places as needed.) Make a conclusion regarding the hypothesis. the null hypothesis. There…arrow_forward
- A study was conducted to determine the proportion of people who dream in black and white instead of color. Among 294 people over the age of 55, 63 dream in black and white, and among 300 people under the age of 25, 19 dream in black and white. Use a 0.05 significance level to test the claim that the proportion of people over 55 who dream in black and white is greater than the proportion for those under 25. Complete parts (a) through (c) below. a. Test the claim using a hypothesis test. Consider the first sample to be the sample of people over the age of 55 and the second sample to be the sample of people under the age of 25. What are the null and alternative hypotheses for the hypothesis test? A. Ho: P₁ = P2 H₁: P₁ P2 D. Ho: P₁ P2 H₁: P₁ P2 OB. Ho: P1 P2 H₁: P₁ P2 O E. Ho: P1 H₁: P₁ P2 P2 O C. Ho: P₁ P2 H₁: P₁ = P2 OF. Ho: P₁ P2 H₁: P₁ P2arrow_forwardOne personality test available on the World Wide Web has a subsection designed to assess the "honesty" of the test-taker. After taking the test and seeing your score for this subsection, you're interested in the mean score, µ, among the general population on this subsection. The website reports that u is 148, but you believe that u is greater than 148. You decide to do a statistical test. You choose a random sample of people and have them take the personality test. You find that their mean score on the subsection is 155 and that the standard deviation of their scores is 28. Based on this information, answer the questions below. What are the null hypothesis (H,) and the alternative hypothesis (H,) that should be used for the test? H: u is ? |H;: µ is ? ? In the context of this test, what is a Type I error? A Type I error is ? fact, u is ? v the hypothesis that u is ? v? v. when, in Suppose that you decide to reject the null hypothesis. What sort of error might you be making? ?arrow_forwardAnswer j and karrow_forward
arrow_back_ios
SEE MORE QUESTIONS
arrow_forward_ios
Recommended textbooks for you
- MATLAB: An Introduction with ApplicationsStatisticsISBN:9781119256830Author:Amos GilatPublisher:John Wiley & Sons Inc
 Probability and Statistics for Engineering and th...StatisticsISBN:9781305251809Author:Jay L. DevorePublisher:Cengage Learning
 Statistics for The Behavioral Sciences (MindTap C...StatisticsISBN:9781305504912Author:Frederick J Gravetter, Larry B. WallnauPublisher:Cengage Learning
  Elementary Statistics: Picturing the World (7th E...StatisticsISBN:9780134683416Author:Ron Larson, Betsy FarberPublisher:PEARSON
 The Basic Practice of StatisticsStatisticsISBN:9781319042578Author:David S. Moore, William I. Notz, Michael A. FlignerPublisher:W. H. Freeman
 Introduction to the Practice of StatisticsStatisticsISBN:9781319013387Author:David S. Moore, George P. McCabe, Bruce A. CraigPublisher:W. H. Freeman
MATLAB: An Introduction with Applications
Statistics
ISBN:9781119256830
Author:Amos Gilat
Publisher:John Wiley & Sons Inc
Probability and Statistics for Engineering and th...
Statistics
ISBN:9781305251809
Author:Jay L. Devore
Publisher:Cengage Learning
Statistics for The Behavioral Sciences (MindTap C...
Statistics
ISBN:9781305504912
Author:Frederick J Gravetter, Larry B. Wallnau
Publisher:Cengage Learning
Elementary Statistics: Picturing the World (7th E...
Statistics
ISBN:9780134683416
Author:Ron Larson, Betsy Farber
Publisher:PEARSON
The Basic Practice of Statistics
Statistics
ISBN:9781319042578
Author:David S. Moore, William I. Notz, Michael A. Fligner
Publisher:W. H. Freeman
Introduction to the Practice of Statistics
Statistics
ISBN:9781319013387
Author:David S. Moore, George P. McCabe, Bruce A. Craig
Publisher:W. H. Freeman