
MATLAB: An Introduction with Applications
6th Edition
ISBN: 9781119256830
Author: Amos Gilat
Publisher: John Wiley & Sons Inc
expand_more
expand_more
format_list_bulleted
Related questions
Question
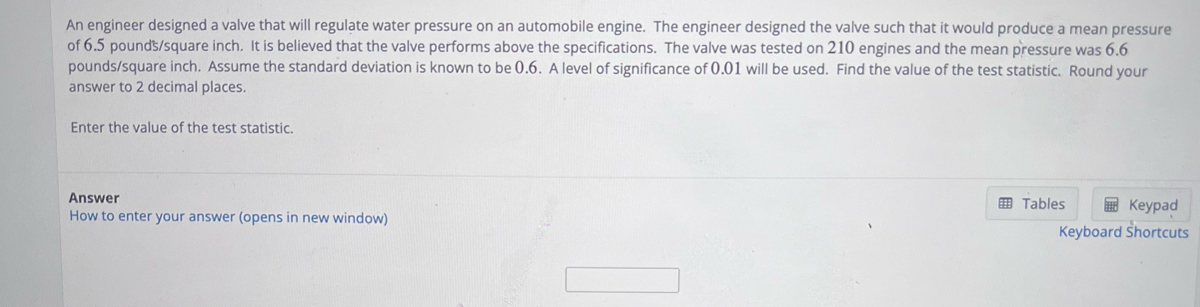

Transcribed Image Text:An engineer designed a valve that will regulate water pressure on an automobile engine. The engineer designed the valve such that it would produce a mean pressure
of 6.5 pounds/square inch. It is believed that the valve performs above the specifications. The valve was tested on 210 engines and the mean pressure was 6.6
pounds/square inch. Assume the standard deviation is known to be 0.6. A level of significance of 0.01 will be used. Find the value of the test statistic. Round your
answer to 2 decimal places.
Enter the value of the test statistic.
Answer
How to enter your answer (opens in new window)
Tables
Keypad
Keyboard Shortcuts
Expert Solution
arrow_forward
Step 1: Information given is
Population mean( )=6.5
)=6.5
sample size(n)=210
sample mean( )=6.6
)=6.6
standard deviation( )=0.6
)=0.6
significance level( )=0.01

Trending nowThis is a popular solution!

Step by stepSolved in 3 steps with 7 images

Knowledge Booster

Similar questions
- A group of students takes the Kaplan course in hopes that it will improve their SAT scores on the math section above the national mean of 500. The population standard deviation of the SAT is known to be 100. The sample mean for the 215 students was 543.53. Calculate the observed z score for the sample.arrow_forwardA California lake has been stocked with rainbow trout. These trout have an average length of 24 inches, with a standard deviation of 3 inches. Someone goes fishing and catches a trout that is 26.25 inches long. Express the length of this trout in standard units, relative to all the trout that were used to stock the lake. Choose the answer below that is closest.arrow_forwardThe weight of newborn babies is normally distributed, with a mean of 3.5 kilograms and a standard deviation of 0.23 kilograms. Find the weight that 14% of newborn babies weigh more than. Round your answer to 2 decimal places. kgarrow_forward
- A study compared the weight loss of people on a low-fat diet versus people on a low-carb diet. In a sample of 100 obese people on a low-fat diet the sample mean weight loss as 7.6 pounds with a standard deviation of 3.2 pounds. In another sample of 120 obese people on a low-carb diet the sample mean weight loss was 6.7 pounds with a standard deviation of 3.9 pounds. Write down all formulas and state the hypothesisa) Test the hypothesis, at the 5% level of significance, that there is a difference in the mean weightloss of using the 2 different diets. b) What is the p-value?arrow_forwardDr. Shoals predicts that people who walk a mile in moderately high heels will have less back pain than when they walk in very high heels. 27 participants walk in 4-inch heels and then 2.5-inch heels. He calculates the standard deviation of the difference scores and finds sD = 3.37. The mean back pain when walking in 4-inch heels is 6.75, and when walking in 2.5-inch heels, it is 3.25. What is the t statistic for this experimentarrow_forwardPlease label each part.arrow_forward
- Please see attachmentarrow_forwardPlz help asap t1.arrow_forwardA medical statistician wants to estimate the average weight loss of people who are on a new diet plan. In a preliminary study, he guesses that the standard deviation of the population of weight loss is about 8 pounds. How large a sample should he take to estimate the mean weight loss to within 4 pounds, with 97% confidence? Sample Size =arrow_forward
- Erin is a nutritionist and cardiologist. She is testing whether the average total cholesterol level of adults in the region is less than 175mgdL. Erin randomly selects 25 people in the region who willingly allowed their blood to be drawn for the survey. Based on several previous studies, Erin assumes that the population standard deviation for the total cholesterol level is 30.22mgdL. For this test: H0:μ=175; Ha:μ<175, which is a left-tailed test. The test results are: z0=−1.158, p-value is = 0.123 Using a 5% level of significance, which of the following are appropriate conclusions for this hypothesis test? Select all that apply. Select all that apply: We reject H0. We fail to reject H0. At the 5% significance level, the data provide sufficient evidence to conclude that the average total cholesterol level of adults in the region is less than 175mgdL. At the 5% significance level, the data do not provide sufficient evidence to conclude that…arrow_forwardThe weights for a baby boy is normally distributed with a mean score of 7lbs and a standard deviation of 0.8lbs. determine the following:arrow_forwardA musicologist is attempting to determine the mean length of modern pop songs. She conducts a sample of 40 songs, and finds a sample mean of 214 seconds., with a standard deviation of 10 secods. Assume that the distribution of lengths of pop songs is nearly normal.Define your variable: Let p be the proportion of pop song that are seconds long. Let μμ be the mean length of the sampled pop songs, in seconds. Let μμ be the mean length of pop songs, in seconds.. Let p be the proprotion of songs in the sample. Create and interpret a 95% Confidence Interval. Round your answers to one decimal place. and seconds.What is the margin of error? Round your answer to one decimal place. seconds.According to Google, the mean length of pop songs is 210210. What do you think of this claim? The claim is inside the interval. It is reasonable. The claim is above the sample mean, so there is no way it can be true. The claim is inside the interval. It must be true. That claim is not in our…arrow_forward
arrow_back_ios
SEE MORE QUESTIONS
arrow_forward_ios
Recommended textbooks for you
- MATLAB: An Introduction with ApplicationsStatisticsISBN:9781119256830Author:Amos GilatPublisher:John Wiley & Sons Inc
 Probability and Statistics for Engineering and th...StatisticsISBN:9781305251809Author:Jay L. DevorePublisher:Cengage Learning
 Statistics for The Behavioral Sciences (MindTap C...StatisticsISBN:9781305504912Author:Frederick J Gravetter, Larry B. WallnauPublisher:Cengage Learning
  Elementary Statistics: Picturing the World (7th E...StatisticsISBN:9780134683416Author:Ron Larson, Betsy FarberPublisher:PEARSON
 The Basic Practice of StatisticsStatisticsISBN:9781319042578Author:David S. Moore, William I. Notz, Michael A. FlignerPublisher:W. H. Freeman
 Introduction to the Practice of StatisticsStatisticsISBN:9781319013387Author:David S. Moore, George P. McCabe, Bruce A. CraigPublisher:W. H. Freeman
MATLAB: An Introduction with Applications
Statistics
ISBN:9781119256830
Author:Amos Gilat
Publisher:John Wiley & Sons Inc
Probability and Statistics for Engineering and th...
Statistics
ISBN:9781305251809
Author:Jay L. Devore
Publisher:Cengage Learning
Statistics for The Behavioral Sciences (MindTap C...
Statistics
ISBN:9781305504912
Author:Frederick J Gravetter, Larry B. Wallnau
Publisher:Cengage Learning
Elementary Statistics: Picturing the World (7th E...
Statistics
ISBN:9780134683416
Author:Ron Larson, Betsy Farber
Publisher:PEARSON
The Basic Practice of Statistics
Statistics
ISBN:9781319042578
Author:David S. Moore, William I. Notz, Michael A. Fligner
Publisher:W. H. Freeman
Introduction to the Practice of Statistics
Statistics
ISBN:9781319013387
Author:David S. Moore, George P. McCabe, Bruce A. Craig
Publisher:W. H. Freeman