
MATLAB: An Introduction with Applications
6th Edition
ISBN: 9781119256830
Author: Amos Gilat
Publisher: John Wiley & Sons Inc
expand_more
expand_more
format_list_bulleted
Related questions
Concept explainers
Topic Video
Question
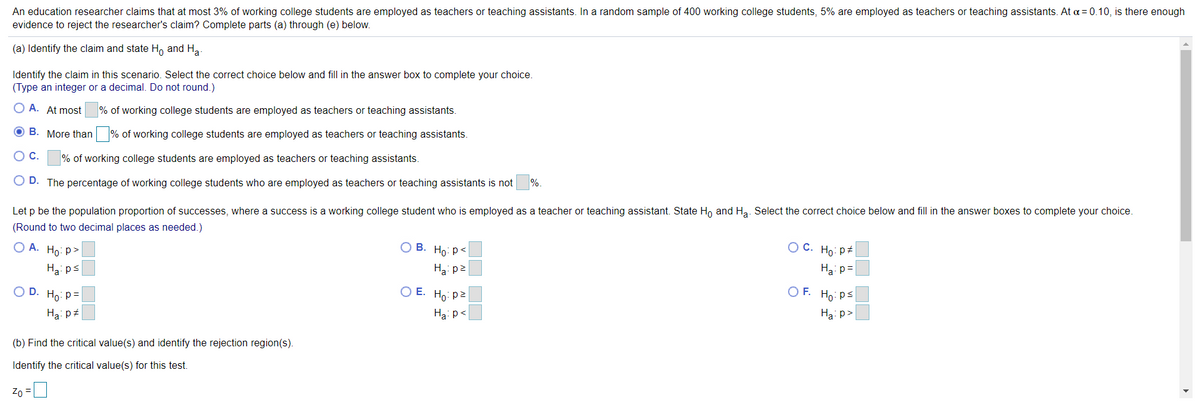

Transcribed Image Text:An education researcher claims that at most 3% of working college students are employed as teachers or teaching assistants. In a random sample of 400 working college students, 5% are employed as teachers or teaching assistants. At a = 0.10, is there enough
evidence to reject the researcher's claim? Complete parts (a) through (e) below.
(a) Identify the claim and state H, and Ha
Identify the claim in this scenario. Select the correct choice below and fill in the answer box to complete your choice.
(Type an integer or a decimal. Do not round.)
O A. At most
% of working college students are employed as teachers or teaching assistants.
O B. More than % of working college students are employed as teachers or teaching assistants.
% of working college students are employed as teachers or teaching assistants.
O D. The percentage of working college students who are employed as teachers or teaching assistants is not
%.
Let p be the population proportion of successes, where a success is a working college student who is employed as a teacher or teaching assistant. State H, and Ha. Select the correct choice below and fill in the answer boxes to complete your choice.
(Round to two decimal places as needed.)
ОА. Но р>
О В. Но: р<
O C. Ho: p
Ha: ps
Ha: p2
Hai p=
O D. Ho: p=
O E. Ho: p2
O F. Ho: ps
Ha: p+
Ha: p<
Ha: p>
(b) Find the critical value(s) and identify the rejection region(s).
Identify the critical value(s) for this test.

Transcribed Image Text:An education researcher claims that at most 3% of working college students are employed as teachers or teaching assistants. In a random sample of 400 working college students, 5% are employed as teachers or teaching assistants. At a = 0.10, is there enough
evidence to reject the researcher's claim? Complete parts (a) through (e) below.
Ha: p
Ha: p<
Ha: p>
(b) Find the critical value(s) and identify the rejection region(s).
Identify the critical value(s) for this test.
Zo
(Round to two decimal places as needed. Use a comma to separate answers as needed.)
Identify the rejection region(s). Select the correct choice below and fill in the answer box(es) to complete your choice.
(Round to two decimal places as needed.)
A. The rejection region is
<z<
B. The rejection regions are z<
and z>
C. The rejection region is z <
D. The rejection region is z>
(c) Find the standardized test statistic z.
z=
(Round to two decimal places as needed.)
(d) Decide whether to reject or fail to reject the null hypothesis and (e) interpret the decision in the context of the original claim.
V the null hypothesis. There
V enough evidence to
V the researcher's claim.
Expert Solution
This question has been solved!
Explore an expertly crafted, step-by-step solution for a thorough understanding of key concepts.

This is a popular solution

Trending nowThis is a popular solution!

Step by stepSolved in 3 steps with 1 images

Knowledge Booster


Learn more about
Need a deep-dive on the concept behind this application? Look no further. Learn more about this topic, statistics and related others by exploring similar questions and additional content below.Similar questions
- A small business ships specialty homemade candies to anywhere in the world. Past records indicate that the weight of orders is normally distributed. Suppose a random sample of 16 orders is selected and each is weighed. The sample mean was found to be 110 grams with a standard deviation of 14 grams. What is the 90% CONFIDENCE INTERVAL for the true mean weight of orders? Select an answer and submit. For keyboard navigation, use the up/down arrow keys to select an answer. a 86.046 to 133.954 grams b 103.86 to 116.14 grams 104.24 to 115.76 grams d. 102.54 to 117.46 gramsarrow_forwardA study was conducted to determine whether big-city and small-town dwellers differed in their helpfulness to strangers. In this study, the investigators rang the doorbells of strangers living in a large City or small towns in the vicinity. They explained they had misplaced the address of a friend living in the neighbourhood and asked to use the phone. The following data show the number of individuals who admitted or did not admit the strangers (the investigators) into their homes: Helpfulness to strangers Admitted strangers into their home Didnot admit strangers into their home Big city dwellers 60 90 Small town dwellers 70 30 State the dependent and independent variable Is this a directional or non directionalarrow_forwardA law enforcement agent believes that 80% of the drivers stopped on Saturday nights for speeding are under the influence of alcohol. Suspecting that the proportion under the influence may be higher than 80%, a SRS of 140 drivers who were stopped for speeding on a Saturday night was taken. 119 of the drivers in the sample were under the influence of alcohol. The correct set of hypotheses is Group of answer choices Ho: p = 0.80 vs Ha: p = 0.85 Ho: p = 0.80 vs Ha: p > 0.80arrow_forward
- An education researcher claims that at most 4% of working college students are employed as teachers or teaching assistants. In a random sample of 600 working college students, 6% are employed as teachers or teaching assistants. At a=0.10, is there enough evidence to reject the researcher's claim? Complete parts (a) through (e) below. Identify the claim in this scenario. Select the corect choice below and fill in the answer box to complete your choice. (Type an integer or a decimal. Do not round.) %. O A. The percentage of working college students who are employed as teachers or teaching assistants is not O B. At most % of working college students are employed as teachers or teaching assistants. OC. More than % of working college students are employed as teachers or teaching assistants. O D. % of working college students are employed as teachers or teaching assistants. Let p be the population, proportion of successes, where a success is a working college student who is employed as a…arrow_forwardWhich of the following research hypotheses is said to be non-directional? Ha: Salary ≠ $165,000 Ha: Obedience < 65%arrow_forwardA company manufacturing CDs is working on a new technology. A random sample of 717 Internet users were asked "As you may know, some CDs are being manufactured so that you can only make one copy of the CD after you purchase it. Would you buy a CD with this technology, or would you refuse to buy it even ifit was one you would normaly buy?" Of hose usert, 56% responded that they would buy the CD. Complete parts a and b below a) Create a 90% confidence interval for this percentage 口口 (Round to three decimal places as needed, Use ascending order.)arrow_forward
- The Food and Drug Administration (FDA) is charged with protecting consumers from unsafe and ineffective drugs on the market. Suppose an effective drug is being tested for safety using the hypotheses: Ho: Drug is safe Ha: Drug is not safe a. Explain the consequence of type I error to the manufacturer. b. Explain the consequence of type II error to the manufacturer.arrow_forwardA humane society claims that less than 62% of households in a certain country own a pet. In a random sample of 500 households in that country, 290 say they own a pet. At a = 0.05, is there enough evidence to support the society's claim? Complete parts (a) through (c) below. (a) Identify the claim and state Ho and H Identify the claim in this scenario. Select the correct choice below and fill in the answer box to complete your choice. (Type an integer or a decimal. Do not round.) O A. Less than % of households in the country own a pet. O B. % of households in the country own a pet. O C. The percentage households in the country that own a pet is not %. O D. More than % of households in the country own a pet. Let p be the population proportion of successes, where a success is a household in the country that owns a pet. State Ho and H.. Select the correct choice below and fill in the answer boxes to complete your choice. (Round to two decimal places as needed.) CO A. Hnipz O B. Hnip= OC.…arrow_forward
arrow_back_ios
arrow_forward_ios
Recommended textbooks for you
- MATLAB: An Introduction with ApplicationsStatisticsISBN:9781119256830Author:Amos GilatPublisher:John Wiley & Sons Inc
 Probability and Statistics for Engineering and th...StatisticsISBN:9781305251809Author:Jay L. DevorePublisher:Cengage Learning
 Statistics for The Behavioral Sciences (MindTap C...StatisticsISBN:9781305504912Author:Frederick J Gravetter, Larry B. WallnauPublisher:Cengage Learning
  Elementary Statistics: Picturing the World (7th E...StatisticsISBN:9780134683416Author:Ron Larson, Betsy FarberPublisher:PEARSON
 The Basic Practice of StatisticsStatisticsISBN:9781319042578Author:David S. Moore, William I. Notz, Michael A. FlignerPublisher:W. H. Freeman
 Introduction to the Practice of StatisticsStatisticsISBN:9781319013387Author:David S. Moore, George P. McCabe, Bruce A. CraigPublisher:W. H. Freeman
MATLAB: An Introduction with Applications
Statistics
ISBN:9781119256830
Author:Amos Gilat
Publisher:John Wiley & Sons Inc
Probability and Statistics for Engineering and th...
Statistics
ISBN:9781305251809
Author:Jay L. Devore
Publisher:Cengage Learning
Statistics for The Behavioral Sciences (MindTap C...
Statistics
ISBN:9781305504912
Author:Frederick J Gravetter, Larry B. Wallnau
Publisher:Cengage Learning
Elementary Statistics: Picturing the World (7th E...
Statistics
ISBN:9780134683416
Author:Ron Larson, Betsy Farber
Publisher:PEARSON
The Basic Practice of Statistics
Statistics
ISBN:9781319042578
Author:David S. Moore, William I. Notz, Michael A. Fligner
Publisher:W. H. Freeman
Introduction to the Practice of Statistics
Statistics
ISBN:9781319013387
Author:David S. Moore, George P. McCabe, Bruce A. Craig
Publisher:W. H. Freeman