
MATLAB: An Introduction with Applications
6th Edition
ISBN: 9781119256830
Author: Amos Gilat
Publisher: John Wiley & Sons Inc
expand_more
expand_more
format_list_bulleted
Related questions
Concept explainers
Question
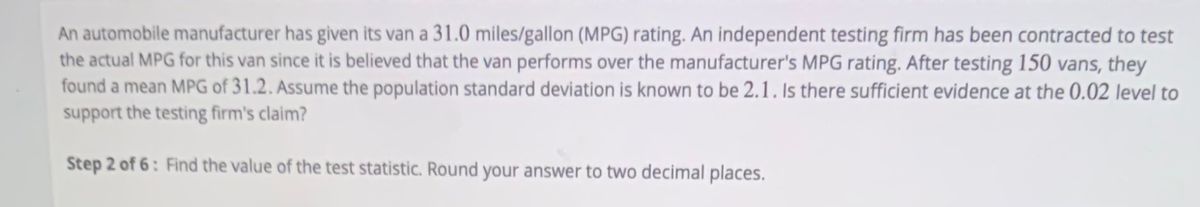

Transcribed Image Text:An automobile manufacturer has given its van a 31.0 miles/gallon (MPG) rating. An independent testing firm has been contracted to test
the actual MPG for this van since it is believed that the van performs over the manufacturer's MPG rating. After testing 150 vans, they
found a mean MPG of 31.2. Assume the population standard deviation is known to be 2.1. Is there sufficient evidence at the 0.02 level to
support the testing firm's claim?
Step 2 of 6: Find the value of the test statistic. Round your answer to two decimal places.
Expert Solution
This question has been solved!
Explore an expertly crafted, step-by-step solution for a thorough understanding of key concepts.

This is a popular solution

Trending nowThis is a popular solution!

Step by stepSolved in 2 steps

Knowledge Booster


Learn more about
Need a deep-dive on the concept behind this application? Look no further. Learn more about this topic, statistics and related others by exploring similar questions and additional content below.Similar questions
- Amanda recently switched her primary doctor to one specializing in caring for elderly patients. On her new doctor's website, it says that the mean systolic blood pressure among elderly females is 115 millimeters of mercury (mmHg). Amanda believes the value is actually higher. She bases her belief on a recently reported study of 17 randomly selected, elderly females. The sample mean systolic blood pressure was 123 mmHg, and the sample standard deviation was 23 mmHg. Assume that the systolic blood pressures of elderly females are approximately normally distributed. Based on the study, at the 0.05 level of significance, can it be concluded that μ, the population mean systolic blood pressure among elderly females, is greater than 115 mmHg? Perform a one-tailed test. Then complete the parts below. Carry your intermediate computations to three or more decimal places. A. Find the value of the test statistic and round to 3 or more decimal places. (I have posted a picture of an example problem…arrow_forwardAn automobile manufacturer claims that their van has a 50.750.7 miles/gallon (MPG) rating. An independent testing firm has been contracted to test the MPG for this van. After testing 2323 vans they found a mean MPG of 50.950.9 with a standard deviation of 2.02.0. Is there sufficient evidence at the 0.10.1 level that the vans outperform the manufacturer's MPG rating? Assume the population distribution is approximately normal. Step 1 of 5 : State the null and alternative hypotheses.arrow_forwardA successful basketball player has a height of 6 feet 11 inches, or 211 cm. Based on statistics from a data set, his height converts to the z score of 5.17. How many standard deviations is his height above the mean?arrow_forward
- The president of a college wants to determine the mean number of units that college students take per semester. How large of a sample is required in order to be 99% sure that a sample mean will be off by no more than 1.25 units? An initial study suggested that the standard deviation is approximately 2.1 units.arrow_forwardA fruit grower wants to test a new spray that a manufacturer claims will reduce the loss due to insect damage. She sprays 20 trees with the new spray and 20 trees with the standard spray. The following data were recorded: New Spray Standard Spray Mean yield per tree(lb) 240 227 Standard deviation 31.3 28.6 Do the data provide evidence that the new spray increases the yield per tree?arrow_forwardCanvas X C Bastien, Inc. has been manufacturing small automobiles that have averaged 50 miles per gallon of gasoline in highway driving. The company has developed a more efficient engine for its small cars and now advertises that its new small cars average more than 50 miles per gallon in highway driving. An independent testing service road-tested 36 of the automobiles. The sample showed an average of 51.5 miles per gallon. The population standard deviation is 6 miles per gallon. a. With a .05 level of significance, test to determine whether or not the manufacturer's advertising campaign is legitimate. b. What is the p-value associated with the sample results? (CSLO 1,6,7) Edit Format Table 12pt v Paragraph BIUA > 2 T² ||arrow_forward
- A parenting magazine reports that the average amount of wireless data used by teenagers each month is 5 Gb. For her science fair project, Ella sets out to prove the magazine wrong. She claims that the mean among teenagers in her area is less than reported. Ella collects information from a simple random sample of 25 teenagers at her high school, and calculates a mean of 4.7 Gb per month with a standard deviation of 0.9 Gb per month. Assume that the population distribution is approximately normal. Test Ella's claim at the 0.01 level of significance. Step 3 of 3: Draw a conclusion and interpret the decision. E Tables E Keypad Answer Keyboard Shortcuts We reject the null hypothesis and conclude that there is sufficient evidence at a 0.01 level of significance that the average amount of wireless data used by teenagers each month is less than 5 Gb. We fail to reject the null hypothesis and conclude that there is insufficient evidence at a 0.01 level of significance that the average amount of…arrow_forwardPlease answer B, C, & D.arrow_forwardA college in the northeastern United States used SAT scores to help decide which applicants to admit. To determine whether the SAT was useful in predicting success, the college examined the relationship between the SAT scores and first-year GPAs of admitted students. The average math SAT score of a sample of 200 randomly selected students was 649.5 with a standard deviation of 66.2. The average GPA of the same students was 2.63 with a standard deviation of 0.58. The correlation between GPA and math SAT score was 0.19. (a) What does the correlation of 0.19 tell us about SAT scores and GPA scores? (You need to provide two answers.)(b) Find the equation of the least squares regression line.(c) Using the equation, predict the GPA score of a person with a math SAT score of 650.(d) Using the equation, predict the GPA score for a person with a math score of 800.arrow_forward
- Low-density lipoprotein, or LDL, is the main source of cholesterol buildup and blockage in the arteries. This is why LDL is known as "bad cholesterol." LDL is measured in milligrams per deciliter of blood, or mg/dL. In a population of adults at risk for cardiovascular problems, the distribution of LDL levels is normal, with a mean of 123 mg/dL and a standard deviation of 41 mg/dL. If an individual's LDL is at least 1 standard deviation or more above the mean, he or she will be monitored carefully by a doctor. What percentage of individuals from this population will have LDL levels 1 or more standard deviations above the mean? Use the 68–95–99.7 rule. (Enter your exact answer as a whole number.) percentage %arrow_forwardA parenting magazine reports that the average amount of wireless data used by teenagers each month is 10 Gb. For her science fair project, Ella sets out to prove the magazine wrong. She claims that the mean among teenagers in her area is less than reported. Ella collects information from a simple random sample of 16 teenagers at her high school, and calculates a mean of 9.1 Gb per month with a standard deviation of 1.3 Gb per month. Assume that the population distribution is approximately normal. Test Ella's claim at the 0.05 level of significance. Step 3 of 3: Draw a conclusion and interpret the decision.arrow_forwardAn automobile manufacturer has given its van a 50.6 miles/gallon (MPG) rating. An independent testing firm has been contracted to test the actual MPG for this van since it is believed that the van has an incorrect manufacturer's MPG rating. After testing 220 vans, they found a mean MPG of 50.5. Assume the population variance is known to be 1.69. A level of significance of 0.01 will be used. Find the P-value of the test statistic. you may write the P-value as a range using interval notation, or as a decimal value rounded to four decimal places.arrow_forward
arrow_back_ios
arrow_forward_ios
Recommended textbooks for you
- MATLAB: An Introduction with ApplicationsStatisticsISBN:9781119256830Author:Amos GilatPublisher:John Wiley & Sons Inc
 Probability and Statistics for Engineering and th...StatisticsISBN:9781305251809Author:Jay L. DevorePublisher:Cengage Learning
 Statistics for The Behavioral Sciences (MindTap C...StatisticsISBN:9781305504912Author:Frederick J Gravetter, Larry B. WallnauPublisher:Cengage Learning
  Elementary Statistics: Picturing the World (7th E...StatisticsISBN:9780134683416Author:Ron Larson, Betsy FarberPublisher:PEARSON
 The Basic Practice of StatisticsStatisticsISBN:9781319042578Author:David S. Moore, William I. Notz, Michael A. FlignerPublisher:W. H. Freeman
 Introduction to the Practice of StatisticsStatisticsISBN:9781319013387Author:David S. Moore, George P. McCabe, Bruce A. CraigPublisher:W. H. Freeman
MATLAB: An Introduction with Applications
Statistics
ISBN:9781119256830
Author:Amos Gilat
Publisher:John Wiley & Sons Inc
Probability and Statistics for Engineering and th...
Statistics
ISBN:9781305251809
Author:Jay L. Devore
Publisher:Cengage Learning
Statistics for The Behavioral Sciences (MindTap C...
Statistics
ISBN:9781305504912
Author:Frederick J Gravetter, Larry B. Wallnau
Publisher:Cengage Learning
Elementary Statistics: Picturing the World (7th E...
Statistics
ISBN:9780134683416
Author:Ron Larson, Betsy Farber
Publisher:PEARSON
The Basic Practice of Statistics
Statistics
ISBN:9781319042578
Author:David S. Moore, William I. Notz, Michael A. Fligner
Publisher:W. H. Freeman
Introduction to the Practice of Statistics
Statistics
ISBN:9781319013387
Author:David S. Moore, George P. McCabe, Bruce A. Craig
Publisher:W. H. Freeman