
A First Course in Probability (10th Edition)
10th Edition
ISBN: 9780134753119
Author: Sheldon Ross
Publisher: PEARSON
expand_more
expand_more
format_list_bulleted
Related questions
Question
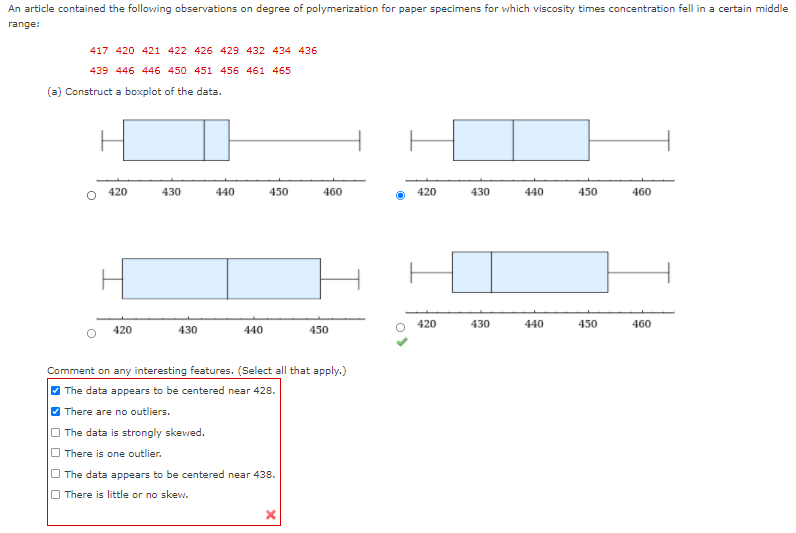

Transcribed Image Text:An article contained the following observations on degree of polymerization for paper specimens for which viscosity times concentration fell in a certain middle
range:
417 420 421 422 426 429 432 434 436
439 446 446 450 451 456 461 465
(a) Construct a boxplot of the data.
420
430
440
450
460
420
430
440
450
460
420
430
440
450
460
420
430
440
450
Comment on any interesting features. (Select all that apply.)
The data appears to be centered near 428.
There are no outliers.
The data is strongly skewed.
There is one outlier.
O The data appears to be centered near 438.
O There is little or no skew.

Transcribed Image Text:(c) Calculate a two-sided 95% confidence interval for true average degree of polymerization. (Round your answers to two decimal places.)
430.54
1445.60
Expert Solution
This question has been solved!
Explore an expertly crafted, step-by-step solution for a thorough understanding of key concepts.

This is a popular solution

Trending nowThis is a popular solution!

Step by stepSolved in 5 steps with 4 images

Knowledge Booster

Similar questions
- An article contained the following observations on degree of polymerization for paper specimens for which viscosity times concentration fell in a certain middle range: 415 420 422 423 426 429 432 435 436 439 446 447 448 452 459 463 464 (a) Construct a boxplot of the data. 420 430 440 450 460 420 430 440 450 460 420 430 440 450 460 420 430 440 450 460 Comment on any interesting features. (Select all that apply.) There are no outliers. There is little or no skew. There is one outlien The data is strongly skewed. The data appears to be centered near 439. The data appears to be centered near 429. (b) Is it plausible that the given sample observations were selected from a normal distribution? O Yes ○ No (c) Calculate a two-sided 95% confidence interval for true average degree of polymerization. (Round your answers to two decimal places.) Does the interval suggest that 445 is a plausible value for true average degree of polymerization? O Yes ○ No Does the interval suggest that 451 is a…arrow_forwardThe following table shows the typical depth (rounded to the nearest foot) for nonfailed wells in geological formations in Baltimore County (The Journal of Data Science, 2009, Vol. 7, pp. 111-127). Geological Formation Group Number of Nonfailed Wells Nonfailed Well Depth Gneiss 1,515 255 Granite 26 218 Loch Raven Schist 3,290 317 Mafic 349 231 Marble 280 267 Prettyboy Schist 1,343 255 Other schists 887 267 Serpentine 36 217 Total 7,726 2,027 Let the random variable X denote the depth (rounded to the nearest foot) for nonfailed wells. Detemine the cumulative distribution function for X. Round your answers to four decimal places (e.g. 98.7654). x < 217 217arrow_forward15. (Percentile, median) The pth percentile of a sample is a number Q, such that at least p% of the sample values are smaller than or equal to Q, and also at least (100 – p)% of those values are larger than or equal to Q. If there is more than one such number (in which case there will be an interval of them), the pth percentile is defined as the average of the numbers (midpoint of that interval). In particular, Q50 is called the middle quartile or median and is denoted by r. Find for the sample in Table 24.2 (Sec. 24.3).arrow_forwardAn article contained the following observations on degree of polymerization for paper specimens for which viscosity times concentration fell in a certain middle range: 415 421 422 423 426 429 431 434 436 439 445 446 448 453 455 463 464 (a) Construct a boxplot of the data. O 420 420 430 430 440 440 450 The data appears to be centered near 438. The data is strongly skewed. There is one outlier. 450 Comment on any interesting features. (Select all that apply.) There are no outliers. The data appears to be centered near 428. There is little or no skew. 460 420 420 430 430 (b) Is it plausible that the given sample observations were selected from a normal distribution? Yes No 440 440 450 450 460 460 (c) Calculate a two-sided 95% confidence interval for true average degree of polymerization. (Round your answers to two decimal places.)arrow_forwardc)arrow_forwardFollowing are measurements of soil concentrations (in mg /kg) of chromium (Cr) and nickel (Ni) at20 sites in the area of Cleveland, Ohio. These data are taken from the article "Variation in NorthAmerican Regulatory Guidance for Heavy Metal Surface Soil Contamination at Commercial andIndustrial Sites" (A. Jennings and J. Ma, J. Environment Eng, 2007:587-609). Cr: 260 19 36 247 263 319 317 277 319 264 23 29 61 119 33 281 21 35 64 30Ni: 435 377 359 53 38 38 54 188 397 33 92 490 28 35 799 347 321 32 74 508 (a) Construct a histogram for each set of concentrations. (b) Find the 1st, 2nd and 3rd quartiles for the Cr concentrations (c) Find the 1st, 2nd and 3rd quartiles for the Ni concentrations.arrow_forwardAn article contained the following observations on degree of polymerization for paper specimens for which viscosity times concentration fell in a certain middle range: 418 420 422 422 425 428 431 434 437 438 445 446 449 451 458 462 465 (a) Construct a boxplot of the data. Comment on any interesting features. (Select all that apply.) The data appears to be centered near 438.There are no outliers.The data is strongly skewed.There is little or no skew.The data appears to be centered near 428.There is one outlier. (b) Is it plausible that the given sample observations were selected from a normal distribution? YesNo (c) Calculate a two-sided 95% confidence interval for true average degree of polymerization. (Round your answers to two decimal places.) , Does the interval suggest that 445 is a plausible value for true average degree of polymerization? YesNo Does the interval suggest that 456 is a plausible value? YesNo You…arrow_forwardAn article contained the following observations on degree of polymerization for paper specimens for which viscosity times concentration fell in a certain middle range: 415 420 421 422 426 427 432 434 437 438 446 447 450 452 457 463 464 (a) Construct a boxplot of the data. 420 430 440 450 460 420 430 440 450 420 430 440 450 460 420 430 440 450 460 Comment on any interesting features. (Select all that apply.) There is one outlier. n The data is strongly skewed. n The data appears to be centered near 428. n There are no outliers. n The data appears to be centered near 438. n There is little or no skew. (b) Is it plausible that the given sample observations were selected from a normal distribution? Yes o No (c) Calculate a two-sided 95% confidence interval for true average degree of polymerization. (Round your answers to two decimal places.) Does the interval suggest that 440 is a plausible value for true average degree of polymerization? o Yes o No Does the interval suggest that 456 is a…arrow_forwardThe shelf life of a high-speed photographic film is being investigated by the manufac- turer. The following data are available (in days). 126 129 134 141 131 132 136 145 116 128 130 162 125 126 134 129 134 127 120 127 120 122 129 133 125 111 147 129 150 148 126 140 130 120 117 131 149 117 143 133 (a) Construct a histogram and comment on the properties of the data. (b) Consider the quantity ₁ (xi - a)². For what value of a is this minimized? (c) Now consider the quantity 1 x - al. What value of a that minimizes this?arrow_forwardarrow_back_iosarrow_forward_ios
Recommended textbooks for you
- A First Course in Probability (10th Edition)ProbabilityISBN:9780134753119Author:Sheldon RossPublisher:PEARSON

A First Course in Probability (10th Edition)
Probability
ISBN:9780134753119
Author:Sheldon Ross
Publisher:PEARSON