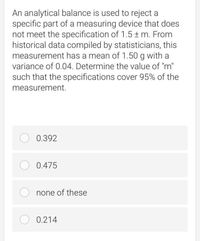
An analytical balance is used to reject a specific part of a measuring device that does not meet the specification of 1.5 ± m. From historical data compiled by statisticians, this measurement has a mean of 1.50 g with a variance of 0.04. Determine the value of "m" such that the specifications cover 95% of the measurement. O 0.392 O 0.475 none of these O 0.214
Q: ssume that the Richter scale magnitudes of earthquakes are normally distributed with a mean of 1.157…
A: Given that μ=1.157 & σ=0.532
Q: Which of the three normal curves below has the lowest mean? Lowest standard deviation? A (В Lowest…
A: The objective is to identify the normal curve that has the lowest mean and lowest standard…
Q: A variable is normally distributed with mean 32 and standard deviation 12. Use the Cumulative…
A: Here it is given that X~ N(32,12). We need to find the required probabilities.
Q: The following data represent the daily emission (in units of 10 kg) of a pollutant from an…
A: Introduction The given study provides the data of daily emission of pollutants from an industrial…
Q: 18 26 33 40 44 45 49 75 80 125
A: “Since you have posted a question with multiple sub-parts, we will solve first three subparts for…
Q: Arandom sample of 83 eighth grade students' scores on a national mathematics assessment test has a…
A: Givensample size(n)=83Mean(x)=267standard deviation(σ)=30α=0.11
Q: A city wants to know if a new advertising campaign to make citizens aware of the dangers of driving…
A: Since you have posted a question with multiple subparts, we will solve first three subparts for you.…
Q: A variable is normally distributed with mean 36 and standard deviation 13. Use the Cumulative…
A: Since you have posted a question with multiple sub-parts, we will solve first three sub- parts for…
Q: The data found below measure the amounts of greenhouse gas emissions from three types of vehicles.…
A: The following information has been provided: Type A Type B Type C 7.4 7.2 8.4 6.1 7.2 9.6…
Q: The Figure below shows the calibration curve for the determination of an analyte. Knowing that the…
A: Using the calibration curve equation y = 0.0005x + 0.0014, we can convert the sample readings to…
Q: a. Is there a significant difference on the ratings of the respondents on Product Line-X11) when…
A: Given information: The tables obtained using SPSS output are given.
Q: The mean square error (MSE) is
A: Here given , actual and forecasting sales for company Z.
Q: . What are the standard score and percentile of a height of 73 inches? The standard score is z=…
A: According to our guidelines, we can answer only three subparts. So please repost the rest subparts.
Q: Height and weight are two measurements used to track a child's development. The World Health…
A:
Q: A study is made of the effect of curing temperature on the compressive strength of a certain type.…
A: Given number of groups = k = 3 since there are three concrete specimens CI, CII and CIII. Total…
Q: Q1. Erythrocytes were examined by light microscopy and found to have the following diameter: 4.7,…
A: Mean is the measure of central tendency. It is calculated by adding all the values and divide it by…
Q: Consider the following information. SSTR = 6750 Ho:µ1 = µ2= 43 = 4 SSE = 8000 Ha: At least one mean…
A:
Q: The mean IQ score of adults is 100, with a standard deviation of 20. Use the Empirical Rule to find…
A:
Q: Find the P value
A: Given data is, Boys Girls 7.9 8.2 8.3 7.5 7.3 5.7 6.4 6.6 8.4 6.4 8.5 8.5 6.9 7.2…
Q: A variable is normally distributed with mean 32 and standard deviation 12. Use the Cumulative…
A:
Q: Which statement is true about where 95% of the possible string tension weight is?
A: A stringing machine is a device for adjusting the tension of strings in a tennis racket. Some tennis…
Q: Create a 95% CI on the mean difference between the following before & after scores of systolic blood…
A: We have the data of before and after scores of systolic blood pressure of six subjects after doses…
Q: None
A: Step 1:Given that Initial TCLP concentrations:6.1, 4.2, 5.8, 6.5 true population mean is 95% The…
Q: 1. The data point that lies at the 50th percentile is also known as the a. mean b. median c. mode d.…
A: (1) Mean: It is one of the most commonly used measures of central tendency. It is the average of…
Q: Choose one FALSE statement about a normal curve. a. A normal curve has exactly half of the values…
A: Solution: It is needed to explain about the normal curve.
Q: Men's heights are normally distributed with a mean of 68.6 inches and a standard deviation of 2.9…
A:
Q: A gasoline distributor wonders whether an individual's income level influences the grade of gasoline…
A: The given dataset is:Person;Type of GasolineIncomeRegularPremiumExtra PremiumLess than…
Q: Assume that a randomly selected subject is given a bone density test. Bone density test scores are…
A: Obtain the 7th percentile of the distribution. The 7thpercentile of the distribution is obtained…
Q: In an experiment to determine whether there is a systematic difference between the weights obtained…
A: In this case the sample units are independent to each other and, the population observations are…
Q: In determining automobile mileage ratings, it was found that the mpg (X) for a certain model is…
A:
Q: what proportion of observations would be less than 5.79? (Enter your answer rounded to four decimal…
A: It is given that Mean, μ = 5.43 Standard deviation, σ = 0.54 Five number summary is: Minimum value…
Q: 1. Consider the following information. SSTR = 6750 H0: μ1 = μ2 = μ3 = μ4 SSE = 8000 Ha: At least…
A: The sum of squares due to error is 8000, and there are four treatments with each 5 samples.
Q: А.B. 16 C.D. 30 E.F. 17 G.H. 31 I.J. 27 K.L. 25 For all questions below, assume a normal…
A: Since you have asked multiple question, we will solve the first question for you. If youwant any…
Q: The data found below measure the amounts of greenhouse gas emissions from three types of vehicles.…
A: Consider that, µ1, µ2, and µ3 define the true mean amount of green hour gas emission from Type 1, 2…
Q: AMA App he yoeir for a partilar test is given by H th P -25-0008) e abnt a.nmANnt Choose the correct…
A:
Q: An indigenous plant is used by natives to help those with anxiety. It is believed by natives to…
A: Given information: The data represents the values of the sample sizes, means and sum of squares.
Q: The acceptable level for insect filth in a certain food item is 5 insect fragments (larvae, eggs,…
A:
Q: Everest auto industry produces bearing for Mahindra Motor Corporation. The precision of radius of…
A: Hey there! Thank you for posting the question. Since you have posted a question with multiple…
Q: The data found below measure the amounts of greenhouse gas emissions from three types of vehicles.…
A: Solution: Given information: k= 3 treatments
Q: Column n Mean Variance Physical Activity days/week Frequency Frequency 600 500 400 300- 200+ 100- 0.…
A: The histogram helps in understanding the distribution of the data.
Q: In an experiment to determine whether there is a systematic difference between the weights obtained…
A: For the given data Critical value = ? What is the test statistic and Conclusion ?
Q: According to United States Department of Agriculture, the average retail price of conventional whole…
A:
Q: A variable is normally distributed with mean 32 and standard deviation 12. Use the Cumulative…
A: Given : A variable is normally distributed with mean 32 and standard deviation of 12. Define random…
Q: Listed below are the overhead widths (in cm) of seals measured from photographs and the weights of…
A: Given that the overhead widths (in cm) of seals measured from photographs and the weights of the…
Step by step
Solved in 2 steps with 2 images
- Each observation in a random sample of 101 bicycle accidents resulting in death was classified according to the day of the week on which the accident occurred. Data consistent with information are given in the following table. Day of Week Sunday Monday Tuesday Wednesday Thursday Friday Saturday Frequency 15 12 12 14 15 18 15 Based on these data, is it reasonable to conclude that the proportion of accidents is not the same for all days of the week? Use a = 0.05. Calculate the test statistic. (Round your answer to two decimal places.) x² Use technology to calculate the P-value. (Round your answer to four decimal places.) P-value = State the conclusion in the problem context. Reject Ho. We have convincing evidence that the proportion of accidents is not the same for all days of the week. Fail to reject Ho. We do not have convincing evidence that the proportion of accidents is not the same for all days of the week. Reject Ho. We do not have convincing evidence that the proportion of…For the data given below, fill in the blanks, using Formulas, Descriptive Statistics and Regression outputs. Mean of X2: 1) 28th Percentile of X1: 2) 3) Standard Deviation of X2: 4) Y XI X2 10 20 400 70 11 30 450 97 12 Median of X2: 10 350 54 5) Correlation Between X1 and Y: Minimum value of X2: 13 20 375 40 14 6) 30 400 65 15 9) bo : 25 400 94 16 7) b,. 30 450 53 17 8) 20 300 35 10) 11) 18 SSR: 10 300 75 19 SSE: 40 300 53 ST: F Statistics: 20 12) Regression output 20 350 64 13) 14) 21 30 450 68 22 Adjusted R Square: 10 400 96 23 15) MSE: 30 325 54 24 16) MSR: 25 17) Standard Error of Regression: 18) 19) 20) 26 Standard error of X2: 27 t-statistics of X2: 28 Fit the regression equation: 29 30 Sheet1Which of the following values represents the standard deviation about your estimate of average age? A. 2.9 B. 31.0 C. 28.2 D. 2.7 E. 1.8 Which age group has the highest age specific survival rate? A. 4 yrs B. 10 yrs C. 0 yrs D. 2 yrs E. 8 yrs F. 6 yrs
- a. What is the value of the standard error of the estimate (to 4 decima b. Test for a significant relationship by using thet test. Use a = 0.05. %3D What is the value of the t test statistic (to 2 decimals)? What is the p-value? Use Table 2 of Appendix B. Select your answer - What is your conclusion (a = 0.05)? %3D Select your answer - c. Use the F test to test for a significant relationship. Use a = 0.05.The standard deviation of a population A. Is the average of the squared deviations between each of the data points and the mean B. Is the average distance from each of the data points to the population's mean C. Is impossible to calculate D. Is only for statisticians E. All of the above F. None of the aboveIn determining automobile mileage ratings, it was found that the mpg (X) for a certain model is normally distributed, with a mean of 40mpg and a standard deviation of 1.8 mpg. Complete parts a through e below. d. Find P(X>39). P(X>39)= (Round to four decimal places as needed.)
- Each observation in a random sample of 98 bicycle accidents resulting in death was classified according to the day of the week on which the accident occurred. Data consistent with information are given in the following table. x² Day of Week Frequency = Sunday Monday Tuesday Wednesday Thursday Friday Saturday 13 12 12 14 13 18 Based on these data, is it reasonable to conclude that the proportion of accidents is not the same for all days of the week? Use a = 0.05. Calculate the test statistic. (Round your answer to two decimal places.) 16 Use technology to calculate the P-value. (Round your answer to four decimal places.) P-value = State the conclusion in the problem context. O Reject Ho. We have convincing evidence that the proportion of accidents is not the same for all days of the week. O Fail to reject Ho. We have convincing evidence that the proportion of accidents is not the same for all days of the week. ● Fail to reject Ho. We do not have convincing evidence that the proportion…A variable is normally distributed with mean 34 and standard deviation 11. Use the Cumulative Z-Score Table to answer the following questions. Write your answers in decimal form using 4 decimal places. a) Find the area under the normal curve to the left of the data value 63.7. b) Find the area under the normal curve to the left of the data value 2.1. c) Find the area under the normal curve to the right of the data value 30.7. d) Find the area under the normal curve to the right of the date value 29.05. e) Find the area under the normal curve between the data values 2.1 and 29.05.03 Consider a DMS X with symbols x, i = 1,2,3,4. Table below lists four possible binary codes. (A) Test the Kraft inequality for the above codes. (B)Show which code is, fixed-length, distinct cades, uniquely decodable and Instantaneous Codes. Give a Code A Code Code C Code D 00 0. 01 10 11 100 reason for your answer. (C) If the symbols x have equal probability, construct the Huffman code for this source. 10 11 100 110 110 110
- To examine the linear correlation between adult age and weight, data was collected from 8 adults. See the table below. Age Weight (Years) (pounds) 35 223 38 231 48 121 50 148 52 219 55 210 56 132 57 218 Does this result suggest that the correlation is statistically significant? Use a = 0.10. Important Note: Round your value for r to three decimals before computing the STS. DO NOT use the built- in LinRegTTest on a calculator because you might get marked wrong. When computing the P-value, use the rounded STS. 1. Select the correct statement: O Even if the correlation is found to be statistically significant, that does not necessarily mean that changes in x cause changes in y O If the correlation is found to be statistically significant, that means that changes in x cause changes in y The hypotheses are: O Ho:r = 0; Ha:r#0 O Ho:r 0 O Ho:p = 0; Ha:p+ 0 O Ho:p 2 0; Ha:p 0 O Ho:r > 0; Ha:r <0 MacBook Air 20 F3 000 11 F8 F4 F5 F6 F7 F9From the graphs displayed, is there evidence to suggest that there is a positive linear relationship between Square Feet and Bathrooms, for the population of real estate represented by this sample? Be sure to provide numeric support in your answer.State the conclusion based on the results of the test. The mean of the pressure required to open a certain valve is known to be u = 6.7 psi. Due to changes in the manufacturing process, the quality-control manager feels that the average pressure has changed. The null hypothesis was rejected. Choose the correct answer below. O A. The mean of the pressure has not changed. O B. There is not sufficient evidence that the mean of the pressure required to open a certain valve has changed. O C. There is not sufficient evidence that the mean of the pressure required to open a certain valve has not changed. O D. The mean of the pressure has changed. O E. There is sufficient evidence that the mean of the pressure required to open a certain valve has changed. O F. There is sufficient evidence that the mean of the pressure required to open a certain valve has not changed.