MATLAB: An Introduction with Applications
6th Edition
ISBN: 9781119256830
Author: Amos Gilat
Publisher: John Wiley & Sons Inc
expand_more
expand_more
format_list_bulleted
Question

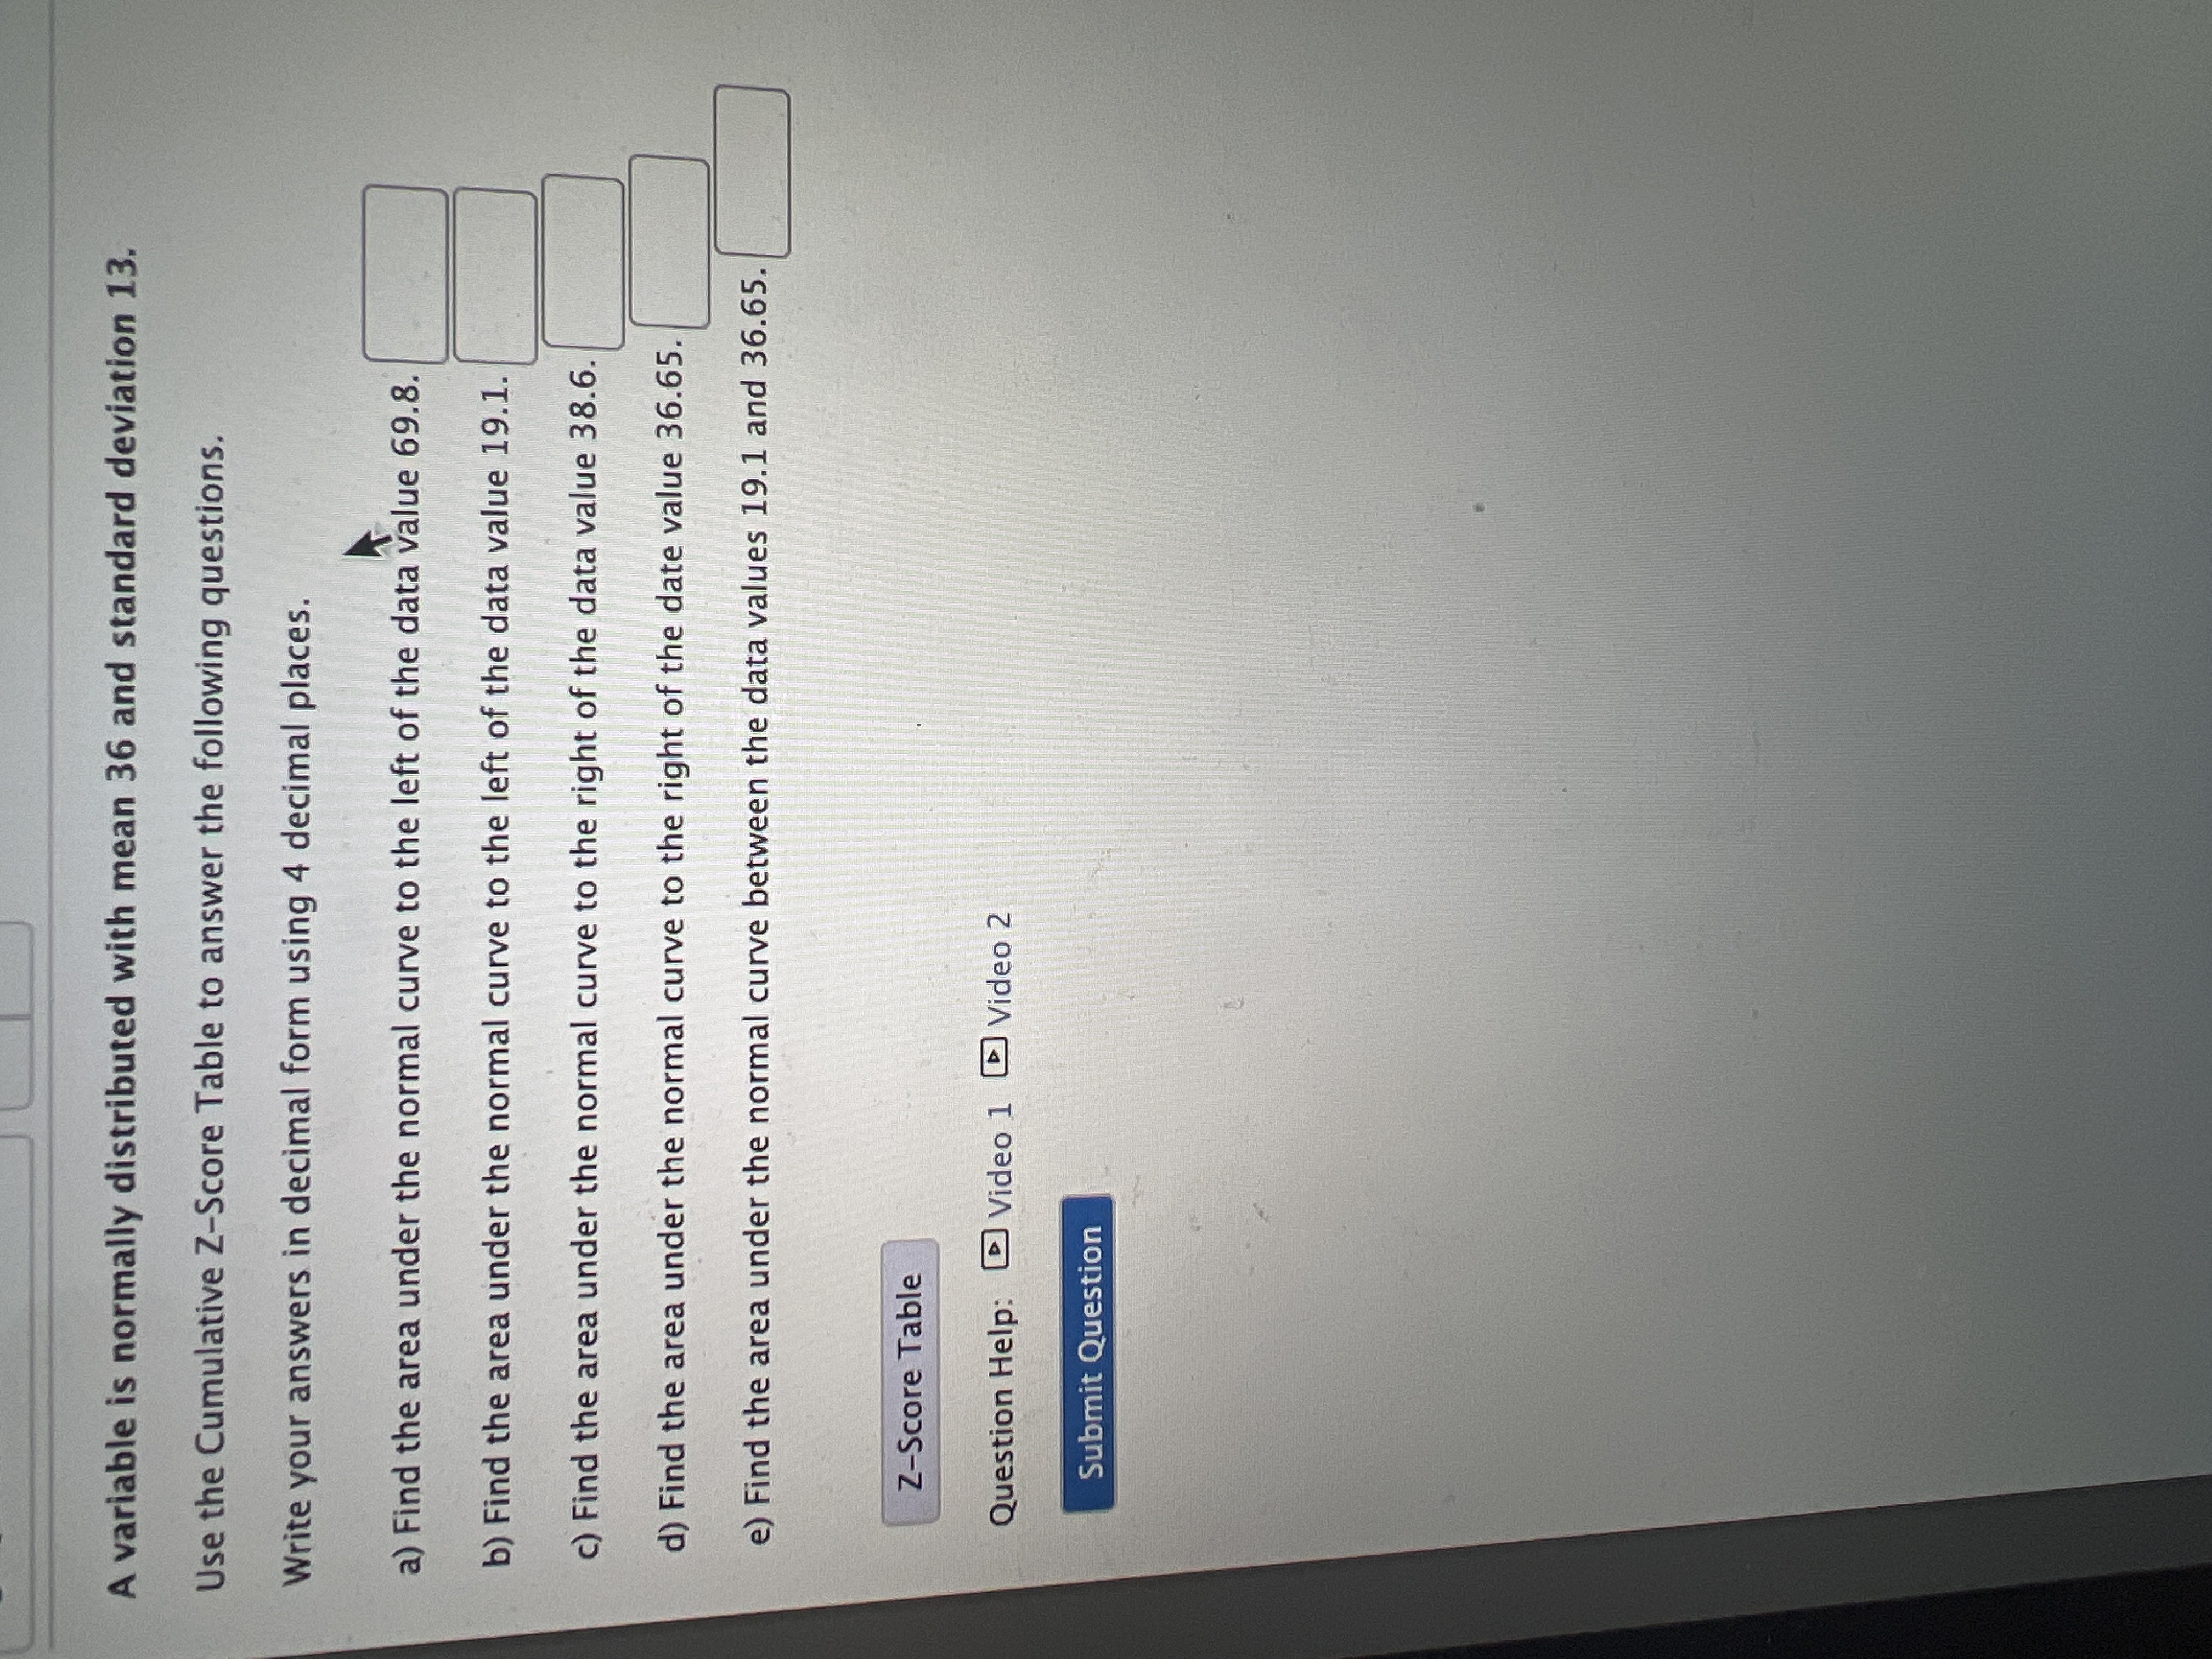
Transcribed Image Text:A variable is normally distributed with mean 36 and standard deviation 13.
Use the Cumulative Z-Score Table to answer the following questions.
Write your answers in decimal form using 4 decimal places.
a) Find the area under the normal curve to the left of the data value 69.8.
b) Find the area under the normal curve to the left of the data value 19.1.
c) Find the area under the normal curve to the right of the data value 38.6.
d) Find the area under the normal curve to the right of the date value 36.65.
e) Find the area under the normal curve between the data values 19.1 and 36.65.
Z-Score Table
Question Help: D Video 1 Video 2
Submit Question
Expert Solution
This question has been solved!
Explore an expertly crafted, step-by-step solution for a thorough understanding of key concepts.
Step by stepSolved in 3 steps with 3 images

Knowledge Booster
Similar questions
- Students in a statistics class took their first test. The following are the scores they earned. Fill in the stem-and-leaf plot below use the tens place as the stem and the ones place as the leaf. Describe the shape of the distribution. 73 84 95 91 98 97 90 74 74 82 63 79 82 88 74 88 67 81 83 69 73 95 91 94 86 56 94 62 a) Data were collected for variable(s). Is it appropriate to make a stem-and-leaf plot for this type of data and number of variables? . b) Complete the stem-and-leaf plot below. You must put commas between the leaves. Stems Leaves 5 c) What shape is the stem-and-leaf plot above?arrow_forwardSolve the problem.The diameter of ball bearings produced in a manufacturing process can be explained using a uniform distribution over the interval 6.5 to 8.5 millimeters. What is the mean diameter produced in this manufacturing process? Select one: A. 8.0 millimeters B. 7.5 millimeters C. 8.5 millimeters D. 7.0 millimetersarrow_forwardConstruct a scatter plot for the following data set. Solve for the correlation coefficient, r. Show your work and explain the steps you used to solve. Round your answer to the nearest thousandth. I 2 3 4 4 3 2 1arrow_forward
- The following set of data represents the number of orders filled by a national-chain restaurant during a two week period. Construct a five number summary for the the data. 66, 75, 68, 89, 86, 73, 67, 75, 75, 82, 85, 74, 67, 61 (Round to the nearest hundredth, if needed). Min _________________ Lower Quartile _________________ Median __________________ Upper Quartile _________________ Maximum __________________ What is the range and the interquartile range (IQR)? Range __________________ Interquartile Range (IQR) ___________________arrow_forwardFind the z-score that has 70.54% of the distribution's area to its right. Click to view page 1 of the table. Click to view page 2 of the table. O A. - 0.82 В. - 0.54 С. 0.82 D. 0.54arrow_forwardFind the proportion of Normally distributed observations with a z-score above -1.93. Give your answer to four decimal places.arrow_forward
- Find the proportion of Normally distributed observations with a zz-score above -1.94. Give your answer to four decimal places.arrow_forwardAssume that the readings on the thermometers are normally distributed with a mean of 0° and standard deviation of 1.00°C. A thermometer is randomly selected and tested. Draw a sketch and find the temperature reading corresponding to P34, the 84th percentile. This is the temperature reading separating the bottom 84% from the top 16%. Click to view page 1 of the table. Click to view page 2 of the table. Which graph represents P ? Choose the correct graph below. 84 A. В. OC. D. Ay X The temperature for P84 is approximately (Round to two decimal places as needed.)arrow_forward
arrow_back_ios
arrow_forward_ios
Recommended textbooks for you
 MATLAB: An Introduction with ApplicationsStatisticsISBN:9781119256830Author:Amos GilatPublisher:John Wiley & Sons Inc
 Probability and Statistics for Engineering and th...StatisticsISBN:9781305251809Author:Jay L. DevorePublisher:Cengage Learning
 Statistics for The Behavioral Sciences (MindTap C...StatisticsISBN:9781305504912Author:Frederick J Gravetter, Larry B. WallnauPublisher:Cengage Learning
 Elementary Statistics: Picturing the World (7th E...StatisticsISBN:9780134683416Author:Ron Larson, Betsy FarberPublisher:PEARSON
 The Basic Practice of StatisticsStatisticsISBN:9781319042578Author:David S. Moore, William I. Notz, Michael A. FlignerPublisher:W. H. Freeman
 Introduction to the Practice of StatisticsStatisticsISBN:9781319013387Author:David S. Moore, George P. McCabe, Bruce A. CraigPublisher:W. H. Freeman

MATLAB: An Introduction with Applications
Statistics
ISBN:9781119256830
Author:Amos Gilat
Publisher:John Wiley & Sons Inc

Probability and Statistics for Engineering and th...
Statistics
ISBN:9781305251809
Author:Jay L. Devore
Publisher:Cengage Learning

Statistics for The Behavioral Sciences (MindTap C...
Statistics
ISBN:9781305504912
Author:Frederick J Gravetter, Larry B. Wallnau
Publisher:Cengage Learning

Elementary Statistics: Picturing the World (7th E...
Statistics
ISBN:9780134683416
Author:Ron Larson, Betsy Farber
Publisher:PEARSON

The Basic Practice of Statistics
Statistics
ISBN:9781319042578
Author:David S. Moore, William I. Notz, Michael A. Fligner
Publisher:W. H. Freeman

Introduction to the Practice of Statistics
Statistics
ISBN:9781319013387
Author:David S. Moore, George P. McCabe, Bruce A. Craig
Publisher:W. H. Freeman