
Related questions
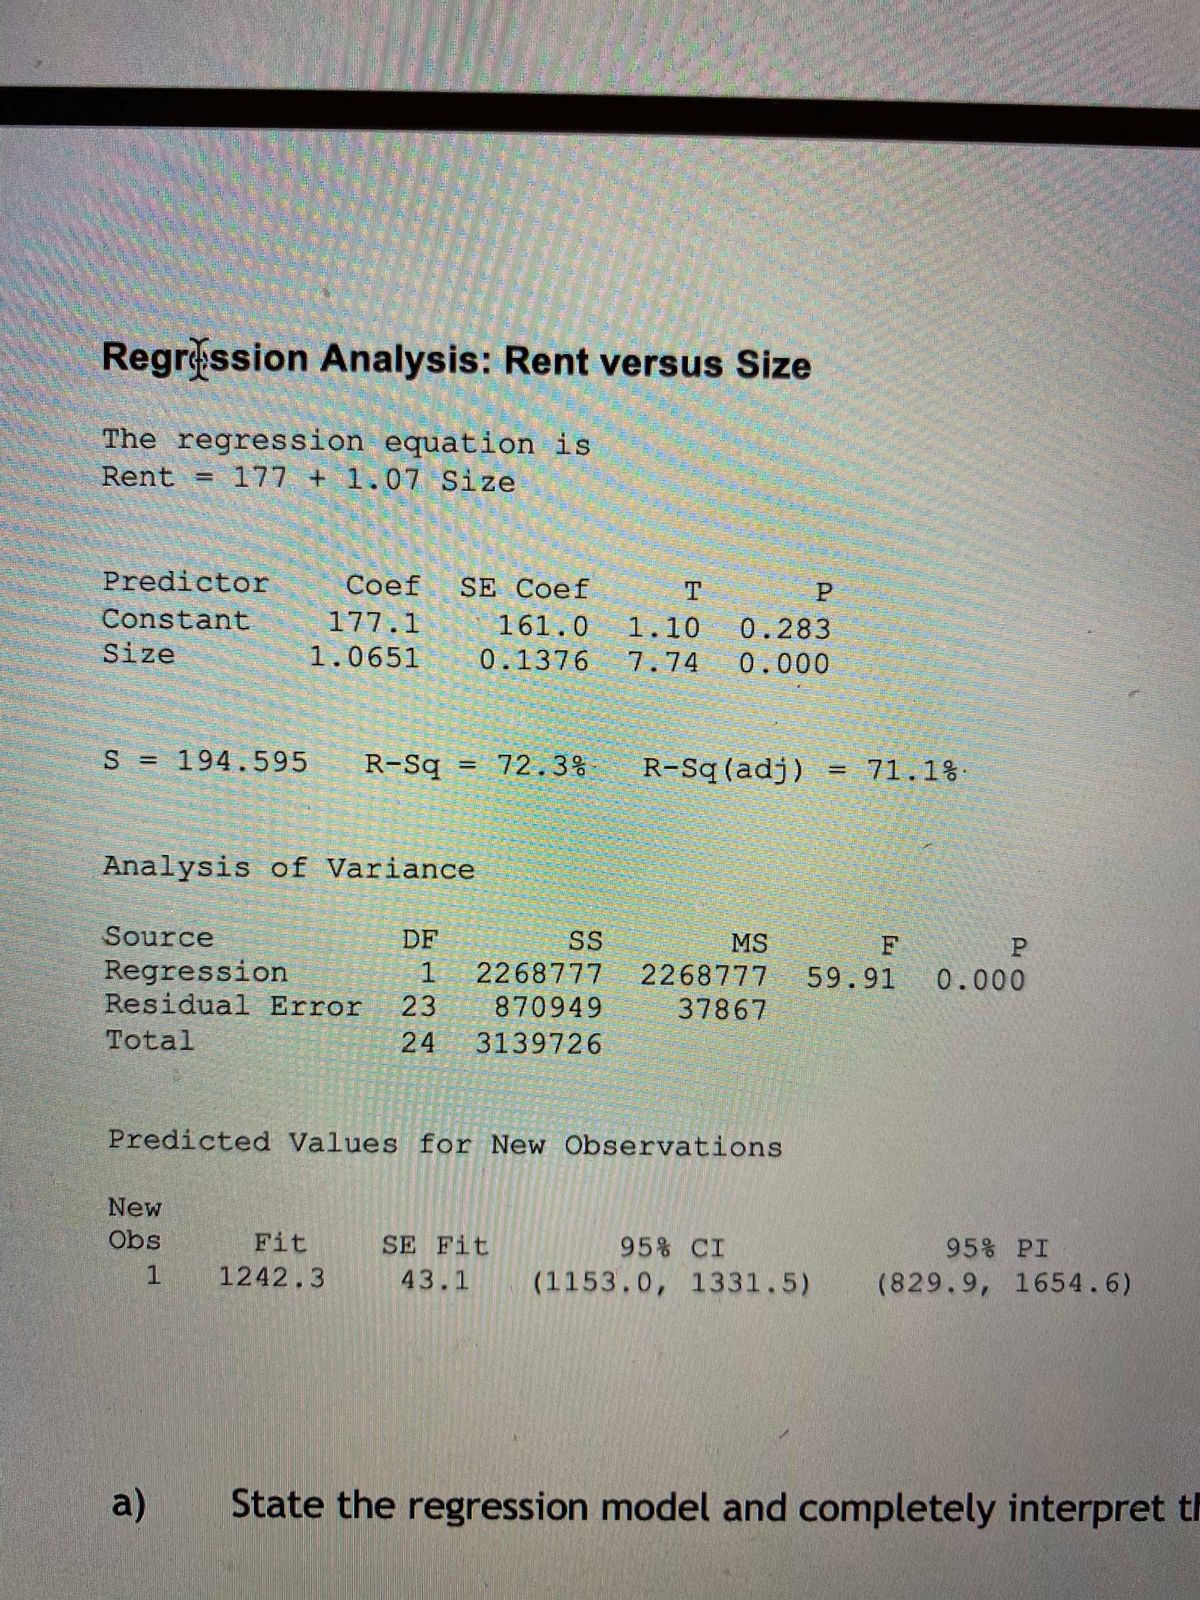
An agent for a property management company would like to be able to predict the monthly rental cost for apartments based on the size of the apartment as defined by square footage. A sample of the rent of 25 apartments in a college rental neighborhood was selected, and the information collected revealed the following:
|
Apartment |
Size (Sq. Ft.) |
Monthly Rent ($) |
|
1 |
850 |
950 |
|
2 |
1,450 |
1,600 |
|
3 |
1,085 |
1,200 |
|
4 |
1,232 |
1,500 |
|
5 |
718 |
950 |
|
6 |
1,485 |
1,700 |
|
7 |
1,136 |
1,650 |
|
8 |
726 |
935 |
|
9 |
700 |
875 |
|
10 |
956 |
1,150 |
|
11 |
1,100 |
1,400 |
|
12 |
1,285 |
1,650 |
|
13 |
1,985 |
2,300 |
|
14 |
1,369 |
1,800 |
|
15 |
1,175 |
1,400 |
|
16 |
1,225 |
1,450 |
|
17 |
1,245 |
1,100 |
|
18 |
1,259 |
1,700 |
|
19 |
1,150 |
1,200 |
|
20 |
896 |
1,150 |
|
21 |
1,361 |
1,600 |
|
22 |
1,040 |
1,650 |
|
23 |
755 |
1,200 |
|
24 |
1,000 |
800 |
|
25 |
1,200 |
1,750 |
i) Determine a 95%
j) Predict the rent of an apartment with 1650 square feet. What is the S.D. of this estimate? ie: determine ŷ1650 and SE(ŷ1650)…SE is the same here as it was in part b.
k) Determine the


Trending nowThis is a popular solution!

Step by stepSolved in 4 steps with 2 images


- Determine which of the four levels of measurement (nominal, ordinal, interval, ratio) is most appropriate for the data below. Brain volumes measured in cubic cmarrow_forwardPlease answer all these questions and label, data included: Size($) Rent(sq.feet) 850 1950 1450 2600 1085 2200 1232 2500 718 1950 1485 2700 1136 2650 726 1935 700 1875 956 2150 1100 2400 1285 2650 1985 3300 1369 2800 1175 2400 1225 2450 1245 2100 1259 2700 1150 2200 896 2150 1361 2600 1040 2650 755 2200 1000 1800 1200 2750 A real estate agent wishes to examine the relationship between the selling price of a home (measured in thousands of dollars) and its size (measured in square feet). In particular she wants to assess if the size of the home can accurately predict the house’s selling price. Use the sample data in the RENT spreadsheet to answer the following questions about the relationship. Which characteristic is the dependent variable? Y = Which characteristic is the independent variable? X = Create a scatter plot for the data set. What does this tell you about the relationship between the variables? 4. What are the…arrow_forwardFrom the following box plot we can say that: Select one: to. the variable is skewed to the right b. the variable is skewed to the left c. mean and median are equal d. there are no atipical valuesarrow_forward
- A student eamed grades of B, C, A, B, and D. Those courses had these corresponding numbers of credit hours: 4, 3, 4, 3, and 2. The grading system assigns quality points to letter grades as follows: A=4, B=3: C=2; D= 1; F=0. Compute the grade-point average (GPA). If the dean's list requires a GPA of 3.00 or greater, did this student make the dean's list? The student's GPA is (Type an integer or decimal rounded to two decimal places as needed.)arrow_forwardWhich of the following could most be considered an ordinal variable? a. Height (ft) b. Weight (kg) c. Body mass index (kg/m2) d. Education level e. Annual Income ($)arrow_forwardJermaine developed a new test to measure IQ. He claimed that using his test, someone with an IQ of 180 would be considered twice as intelligent as someone with an IQ of 90 and that someone with an IQ of 90 was three times as intelligent as someone with an IQ of 30. Jermaine's test treats IQ as Select one: a. a ratio variable b. an interval variable c. an ordinal variable d. a nominal variablearrow_forward
- Please answer all these questions and label, data included: Size($) Rent(sq.feet) 850 1950 1450 2600 1085 2200 1232 2500 718 1950 1485 2700 1136 2650 726 1935 700 1875 956 2150 1100 2400 1285 2650 1985 3300 1369 2800 1175 2400 1225 2450 1245 2100 1259 2700 1150 2200 896 2150 1361 2600 1040 2650 755 2200 1000 1800 1200 2750 10. Based on all of the above questions, what will you conclude about the relationship between house size and rent price? 11. Construct a 95% confidence interval estimate of the population slope, β1. 12. Construct a 95% confidence estimate of the mean renting cost of a house that is 2000 square feet. 13. Construct a 95% prediction interval of the renting cost of an individual house that is 2000 square feet.arrow_forwardA sample of single persons receiving Social Security payments revealed these monthly benefits: $840, $896, $1,064, $860, $742, and $812. How many observations are below the median? Select one: a. 1 b. 3 c. 3.5 d. 2arrow_forwardPlease help me with the below question.arrow_forward
- Given the weekly price and quantity (Qx and (Px) data for Andy’s ice cream over the past 12 weeks and the price of another ice-cream flavor (Po) as: Qx 84 82 85 83 82 84 87 81 82 79 82 78 Px 8.50 9.00 8.75 9.25 9.50 9.25 8.25 10.00 10.00 10.50 9.50 10.25 Po 5.25 6.00 6.00 6.50 6.25 6.25 5.25 7.00 7.25 7.25 6.75 7.25 a. Use excel regression to estimate the weekly demand for Andy’s ice-cream (attach the output of the regression estimate (Hint: Use regression in excel to find the estimated demand function: Enter the data in excel, click on Data Analysis, and use the regression command). b. Are the coefficients on the two prices statistically significantly different from zero at the 5% significance level? How do you know? c. What the R2? d. Explain what R2 means.arrow_forwardA congressperson wants to come up with a single value to describe the prices of homes in their district. However, their district consists of a few homes that are extremely expensive compared to the others. Which descriptive statistic should they use? a. Range b. Mode c. Median d. Meanarrow_forwardWith this chart, what would be the most appropriate scatter plot from these choices?arrow_forward
- MATLAB: An Introduction with ApplicationsStatisticsISBN:9781119256830Author:Amos GilatPublisher:John Wiley & Sons Inc
 Probability and Statistics for Engineering and th...StatisticsISBN:9781305251809Author:Jay L. DevorePublisher:Cengage Learning
 Statistics for The Behavioral Sciences (MindTap C...StatisticsISBN:9781305504912Author:Frederick J Gravetter, Larry B. WallnauPublisher:Cengage Learning
  Elementary Statistics: Picturing the World (7th E...StatisticsISBN:9780134683416Author:Ron Larson, Betsy FarberPublisher:PEARSON
 The Basic Practice of StatisticsStatisticsISBN:9781319042578Author:David S. Moore, William I. Notz, Michael A. FlignerPublisher:W. H. Freeman
 Introduction to the Practice of StatisticsStatisticsISBN:9781319013387Author:David S. Moore, George P. McCabe, Bruce A. CraigPublisher:W. H. Freeman