All Bookma A meteorologist measures the atmospheric pressure P (in kilograms per square meter) at altitude h (in kilometers). The data are shown below. Altitude, h 0 5 10 15 20 Pressure, P 10,322 5,593 2,386 1,250 507 (a) Use the regression capabilities of a graphing utility to find the least squares regression line for the points (h, In(P)). (Round your numerical values to four decimal places.) In(P)= (b) The result in part (a) is an equation of the form In(P) = ah + b. Write this logarithmic form in exponential form. (Round your numerical values to four decimal places.) P = (c) Use a graphing utility to plot the original data and graph the exponential model in part (b). (Select Update Graph to see your response plotted on the screen. Select the Submit button to grade your response.) Update Graph Student Response Graph Student Response Graph Description
All Bookma A meteorologist measures the atmospheric pressure P (in kilograms per square meter) at altitude h (in kilometers). The data are shown below. Altitude, h 0 5 10 15 20 Pressure, P 10,322 5,593 2,386 1,250 507 (a) Use the regression capabilities of a graphing utility to find the least squares regression line for the points (h, In(P)). (Round your numerical values to four decimal places.) In(P)= (b) The result in part (a) is an equation of the form In(P) = ah + b. Write this logarithmic form in exponential form. (Round your numerical values to four decimal places.) P = (c) Use a graphing utility to plot the original data and graph the exponential model in part (b). (Select Update Graph to see your response plotted on the screen. Select the Submit button to grade your response.) Update Graph Student Response Graph Student Response Graph Description

Elementary Linear Algebra (MindTap Course List)
8th Edition
ISBN:9781305658004
Author:Ron Larson
Publisher:Ron Larson
Chapter2: Matrices
Section2.CR: Review Exercises
Problem 90CR

Related questions
Question
Transcribed Image Text:All Bookmarks
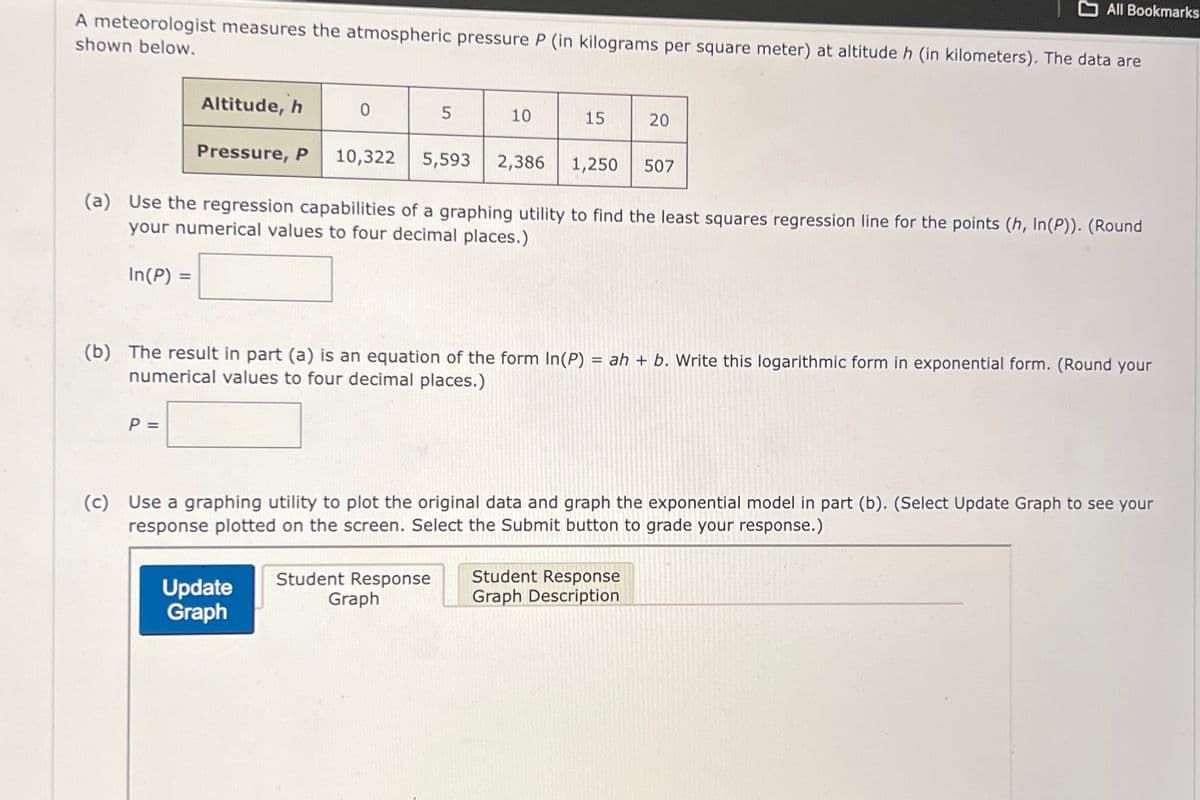
A meteorologist measures the atmospheric pressure P (in kilograms per square meter) at altitude h (in kilometers). The data are
shown below.
Altitude, h
0
5
10
15
20
Pressure, P 10,322
5,593 2,386
1,250
507
(a) Use the regression capabilities of a graphing utility to find the least squares regression line for the points (h, In(P)). (Round
your numerical values to four decimal places.)
In(P) =
(b) The result in part (a) is an equation of the form In(P) = ah + b. Write this logarithmic form in exponential form. (Round your
numerical values to four decimal places.)
P =
(c) Use a graphing utility to plot the original data and graph the exponential model in part (b). (Select Update Graph to see your
response plotted on the screen. Select the Submit button to grade your response.)
Update
Graph
Student Response
Graph
Student Response
Graph Description
Expert Solution
This question has been solved!
Explore an expertly crafted, step-by-step solution for a thorough understanding of key concepts.

This is a popular solution!

Trending now
This is a popular solution!

Step by step
Solved in 5 steps with 8 images

Recommended textbooks for you
Elementary Linear Algebra (MindTap Course List)
Algebra
ISBN:
9781305658004
Author:
Ron Larson
Publisher:
Cengage Learning

Linear Algebra: A Modern Introduction
Algebra
ISBN:
9781285463247
Author:
David Poole
Publisher:
Cengage Learning
Elementary Linear Algebra (MindTap Course List)
Algebra
ISBN:
9781305658004
Author:
Ron Larson
Publisher:
Cengage Learning
Linear Algebra: A Modern Introduction
Algebra
ISBN:
9781285463247
Author:
David Poole
Publisher:
Cengage Learning