
MATLAB: An Introduction with Applications
6th Edition
ISBN: 9781119256830
Author: Amos Gilat
Publisher: John Wiley & Sons Inc
expand_more
expand_more
format_list_bulleted
Related questions
Question
i need the answer quickly
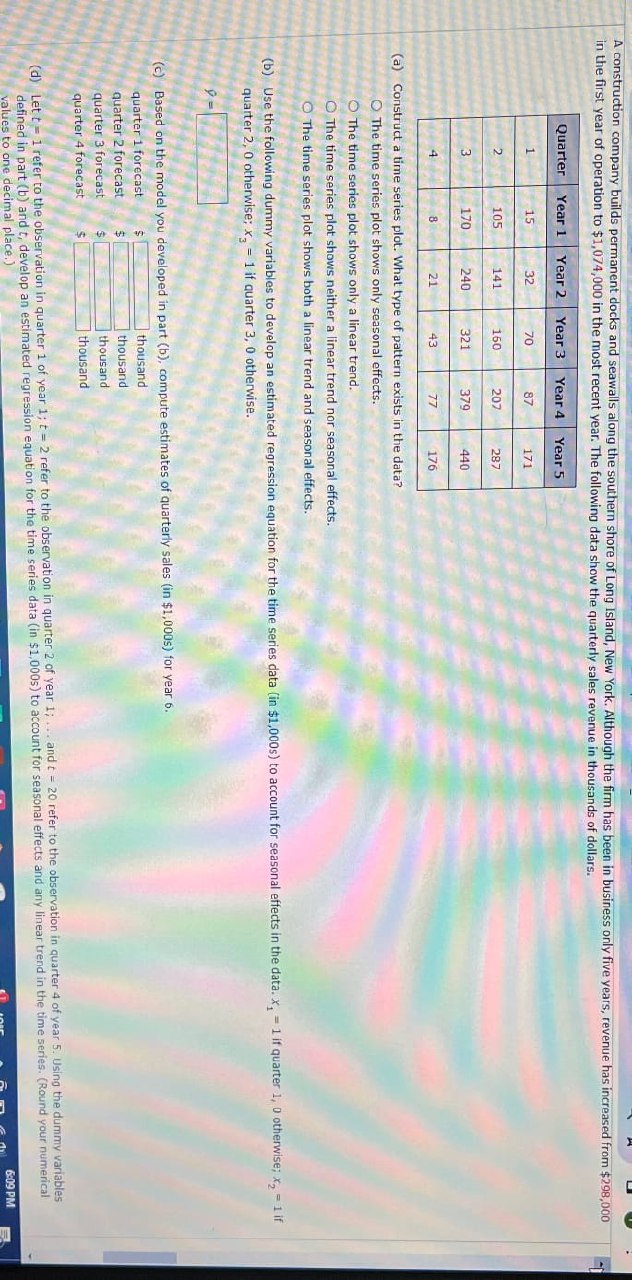

Transcribed Image Text:A construction company builds permanent docks and seawalls along the southern shore of Long Island, New York. Although the firm has been in business only five years, revenue has increased from $298,000
in the first year of operation to $1,074,000 in the most recent year. The following data show the quarterly sales revenue in thousands of dollars.
Quarter Year 1 Year 2 Year 3 Year 4 Year 5
1
15
32
70
87
171
2
105
141
160
207
287
3
170
240
321
379
440
4
8
21
43
77
176
(a) Construct a time series plot. What type of pattern exists in the data?
O The time series plot shows only seasonal effects.
The time series plot shows only a linear trend.
O The time series plot shows neither a linear trend nor seasonal effects.
O The time series plot shows both a linear trend and seasonal effects.
(b) Use the following dummy variables to develop an estimated regression equation for the time series data (in $1,000s) to account for seasonal effects in the data. x, 1 if quarter 1, 0 otherwise; x = 1 if
quarter 2, 0 otherwise; x = 1 if quarter 3, 0 otherwise.
(c) Based on the model you developed in part (b), compute estimates of quarterly sales (in $1,000s) for year 6.
quarter 1 forecast
quarter 2 forecast
quarter 3 forecast
$
quarter 4 forecast
thousand
thousand
thousand
thousand
(d) Lett 1 refer to the observation in quarter 1 of year 1; t = 2 refer to the observation in quarter 2 of year 1;... and t = 20 refer to the observation in quarter 4 of year 5. Using the dummy variables
defined in part (b) and t, develop an estimated regression equation for the time series data (in $1,000s) to account for seasonal effects and any linear trend in the time series. (Round your numerical
values to one decimal place.)
6:09 PM
Expert Solution
This question has been solved!
Explore an expertly crafted, step-by-step solution for a thorough understanding of key concepts.

This is a popular solution

Trending nowThis is a popular solution!

Step by stepSolved in 5 steps with 27 images

Knowledge Booster

Similar questions
arrow_back_ios
arrow_forward_ios
Recommended textbooks for you
- MATLAB: An Introduction with ApplicationsStatisticsISBN:9781119256830Author:Amos GilatPublisher:John Wiley & Sons Inc
 Probability and Statistics for Engineering and th...StatisticsISBN:9781305251809Author:Jay L. DevorePublisher:Cengage Learning
 Statistics for The Behavioral Sciences (MindTap C...StatisticsISBN:9781305504912Author:Frederick J Gravetter, Larry B. WallnauPublisher:Cengage Learning
  Elementary Statistics: Picturing the World (7th E...StatisticsISBN:9780134683416Author:Ron Larson, Betsy FarberPublisher:PEARSON
 The Basic Practice of StatisticsStatisticsISBN:9781319042578Author:David S. Moore, William I. Notz, Michael A. FlignerPublisher:W. H. Freeman
 Introduction to the Practice of StatisticsStatisticsISBN:9781319013387Author:David S. Moore, George P. McCabe, Bruce A. CraigPublisher:W. H. Freeman
MATLAB: An Introduction with Applications
Statistics
ISBN:9781119256830
Author:Amos Gilat
Publisher:John Wiley & Sons Inc
Probability and Statistics for Engineering and th...
Statistics
ISBN:9781305251809
Author:Jay L. Devore
Publisher:Cengage Learning
Statistics for The Behavioral Sciences (MindTap C...
Statistics
ISBN:9781305504912
Author:Frederick J Gravetter, Larry B. Wallnau
Publisher:Cengage Learning
Elementary Statistics: Picturing the World (7th E...
Statistics
ISBN:9780134683416
Author:Ron Larson, Betsy Farber
Publisher:PEARSON
The Basic Practice of Statistics
Statistics
ISBN:9781319042578
Author:David S. Moore, William I. Notz, Michael A. Fligner
Publisher:W. H. Freeman
Introduction to the Practice of Statistics
Statistics
ISBN:9781319013387
Author:David S. Moore, George P. McCabe, Bruce A. Craig
Publisher:W. H. Freeman