
Glencoe Algebra 1, Student Edition, 9780079039897, 0079039898, 2018
18th Edition
ISBN: 9780079039897
Author: Carter
Publisher: McGraw Hill
expand_more
expand_more
format_list_bulleted
Related questions
Question
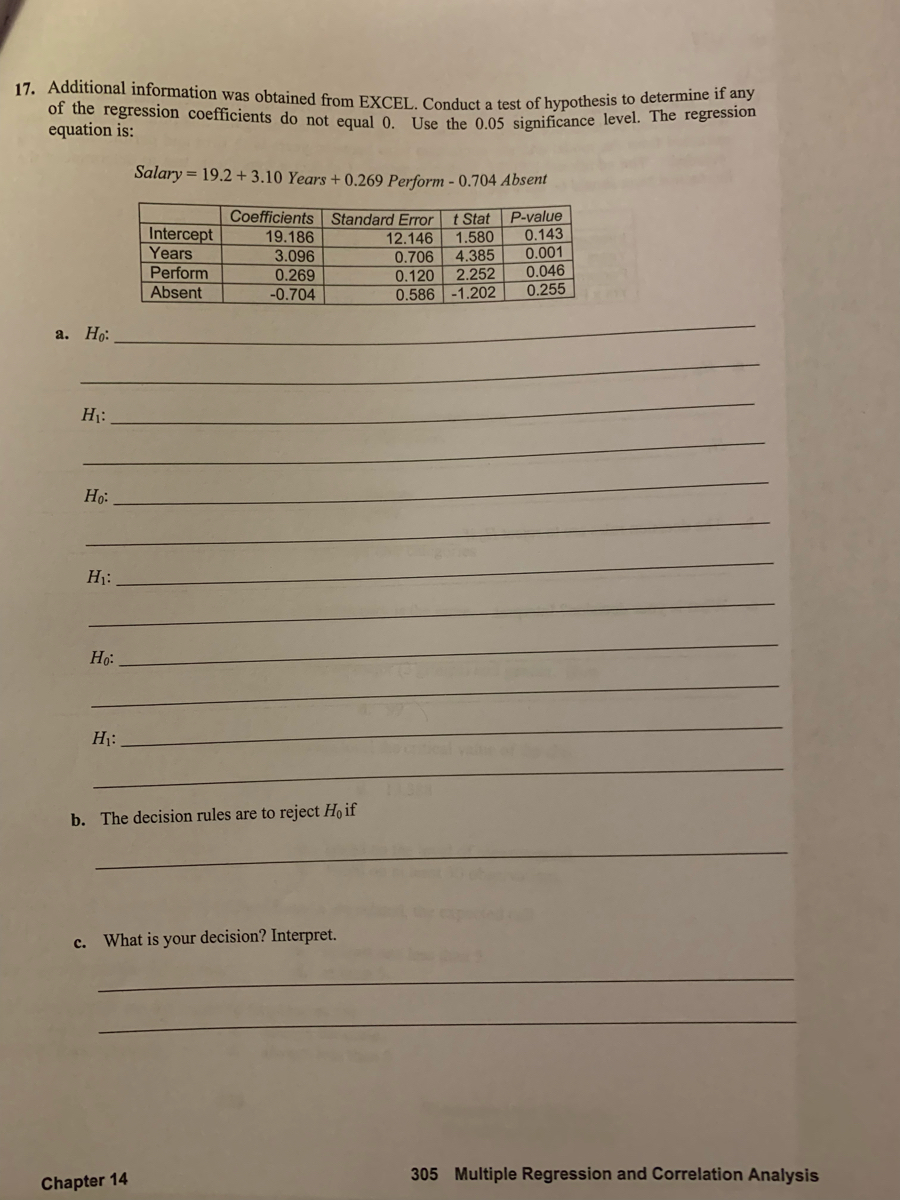

Transcribed Image Text:17. Additional information was obtained from EXCEL. Conduct a test of hypothesis to determine if any
of the regression coefficients do not equal 0 Use the 005 significance level. The regression
equation is:
Salary = 19.2 + 3.10 Years + 0.269 Perform - 0.704 Absent
Intercept
Years
Perform
Absent
Coefficients Standard Error
19.186
3.096
0.269
-0.704
12.146
0.706
0.120
0.586 -1.202
t Stat
1.580
4.385
P-value
0.143
0.001
0.046
0.255
2.252
а. Но:
H:
Họ:
H1:
Họ:
H1:
b. The decision rules are to reject Ho if
What is your decision? Interpret.
c.
305 Multiple Regression and Correlation Analysis
Chapter 14
Expert Solution
This question has been solved!
Explore an expertly crafted, step-by-step solution for a thorough understanding of key concepts.

Step by stepSolved in 2 steps

Knowledge Booster

Similar questions
- A simple linear regression model was created based on 25 samples. The 95% confidence interval for the estimate of B, is (1.5, 4.8). What is thet-statistic for B1? Report your answer in 3 decimal places.arrow_forwardIn a hypothesis test, the p-value was calculated as 0.025. If the level of significance is, a = 0.05, what is the decision regarding the null hypothesis test? Reject the null hypothesis.. Do not reject the null hypothesis. No definitive conclusion can be made. In a hypothesis, p-value and level of significance has no relationship.arrow_forwardConstruct a 99% confidence interval for the slope of the population regression line. Give your answers precise to at least two decimal places.arrow_forward
- Please do not give solution in image format thanku In a regression study, a 95% confidence interval for the coefficient ?1 was given as: (-3.15, 1.01) True or false: At the 5% significance level, this coefficient is significant.arrow_forwardIn the regression equation -5,23+2.74x and n-24, the mean of x is 1256, 55-55.87 and 5-1071. A 90% confidence interval for y when x-11 is, O (2.74,5.23) O (16.21, 54.531 (30,00, 40.74) O (35.37,70,74) O (12.56, 55.87)arrow_forwardA 95 percent confidence interval for the slope of the regression line relating the number of grams of carbohydrates and the number of kilocalories per 100-gram sample of various raw foods is given by (2.505, 6.696). The confidence interval is based on a random sample of n raw foods. A check of the conditions for inference on the slope shows they are reasonably met. Which of the following is a correct interpretation of the interval? Ninety-five percent of all such samples of size n will produce a sample slope between 2.505 and 6.696 for the regression line relating grams of carbohydrates and kilocalories per 100-gram sample of various raw foods. The probability is 0.95 that the true slope of the regression line relating grams of carbohydrates and kilocalories per 100-gram sample of various raw foods is between 2.505 and 6.696. C We are 95 percent confident that the slope of the regression line for the random sample of n raw foods is between 2.505 and 6.696. We are 95 percent confident…arrow_forward
- Suppose that a sample of n = 12 pairs of X and Y scores has SSY = 90 and a Pearson correlation of r = +0.40. Does the regression equation predict a significant portion of the variance? Test with α = .05.(hint: SStotal = SSY; r2 = SSregression/SSTotal)arrow_forwardBaseball statisticians studied how often triples (a certain event in a baseball game) occurred in professional games played between 1947 and 2017. A 98 percent confidence interval to estimate the slope of the linear regression line relating the year, x, and the mean number of triples per game, y, yielded (−0.006,−0.002). A check shows that the conditions necessary for inference for the slope of the regression line are met. Based on the confidence interval, which of the following claims is supported? The mean number of triples per game is between 0.002 and 0.006. A The number of triples per game has increased, on average, per year. B There is no linear relationship between the mean number of triples per game and year. C There is a negative linear relationship between the mean number of triples per game and year. D A conclusion cannot be made about the relationship between year and mean number of triples per game because the values are close to…arrow_forwardplease help me fill the rest thanksarrow_forward
- A professor at the University of Alabama was interested in evaluating the relationship between family support and delinquency. Using data collected on 4545 families, the researcher used regression to analyze the relationship. The results are presented below. What is the predicted value for delinquency for a family with a family support score of 546? Using an alpha level of .05, is there a statistically significant relationship between family support and delinquency? Based on your decision regarding statistical significance, what type of error might you be making? What is the effect size for the relationship between family support and delinquency? Is the effect size for the relationship between family support and delinquency, small, medium, or large?arrow_forwardConsider the results in Table 5. After running the regression, we test whether thecoefficients of the variables hhsize1 and hhsize2 are equal at 5% significance level.The value of the F-statistic is 26.32. Note that the sample size is 1,593. What is theoutcome of the test?arrow_forwardSo I generated this table with stat program, which is from a regression of temperature (in °C) on atmospheric concentrationof carbon dioxide (CO2), in ppm. Can you please construct a 95% confidence interval for the slope of the regression equation? Also, what are the chances of seeing a linear relationship at least as strong as observed from these data, when in fact there was none in the population? What would be the conclusion from this regression?arrow_forward
arrow_back_ios
SEE MORE QUESTIONS
arrow_forward_ios
Recommended textbooks for you
- Glencoe Algebra 1, Student Edition, 9780079039897...AlgebraISBN:9780079039897Author:CarterPublisher:McGraw Hill
 Big Ideas Math A Bridge To Success Algebra 1: Stu...AlgebraISBN:9781680331141Author:HOUGHTON MIFFLIN HARCOURTPublisher:Houghton Mifflin Harcourt
 Holt Mcdougal Larson Pre-algebra: Student Edition...AlgebraISBN:9780547587776Author:HOLT MCDOUGALPublisher:HOLT MCDOUGAL
Glencoe Algebra 1, Student Edition, 9780079039897...
Algebra
ISBN:9780079039897
Author:Carter
Publisher:McGraw Hill
Big Ideas Math A Bridge To Success Algebra 1: Stu...
Algebra
ISBN:9781680331141
Author:HOUGHTON MIFFLIN HARCOURT
Publisher:Houghton Mifflin Harcourt
Holt Mcdougal Larson Pre-algebra: Student Edition...
Algebra
ISBN:9780547587776
Author:HOLT MCDOUGAL
Publisher:HOLT MCDOUGAL