MATLAB: An Introduction with Applications
6th Edition
ISBN: 9781119256830
Author: Amos Gilat
Publisher: John Wiley & Sons Inc
expand_more
expand_more
format_list_bulleted
Question
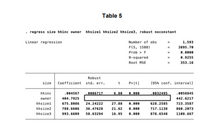
Consider the results in Table 5. After running the regression, we test whether the
coefficients of the variables hhsize1 and hhsize2 are equal at 5% significance level.The value of the F-statistic is 26.32. Note that the
outcome of the test?

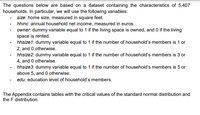
Transcribed Image Text:The questions below are based on a dataset containing the characteristics of 5,407
households. In particular, we will use the following variables:
- size: home size, measured in square feet.
- hhinc: annual household net income, measured in euros.
- owner. dummy variable equal to 1 if the living space is owned, and 0 if the living
space is rented.
- hhsize1: dummy variable equal to 1 if the number of household's members is 1 or
2, and 0 otherwise.
hhsize2: dummy variable equal to 1 if the number of household's members is 3 or
4, and 0 otherwise.
hhsize3: dummy variable equal to 1 if the number of household's members is 5 or
above 5, and 0 otherwise.
- edu: education level of household's members.
The Appendix contains tables with the critical values of the standard normal distribution and
the F distribution.

Transcribed Image Text:Table 5
. regress size hhinc owner hhsizel hhsizez hhsize3, robust noconstant
Linear regression
Nunber of obs
1,593
F(5, 1588)
3895.70
Prob > F
0.0000
R-squared
0.9255
Root MSE
353.16
Robust
size
Coefficient std. err.
t
P>|t|
(95% conf. interval)
hhinc
6.80 0.000
.004567
0006717
0032495
.0058845
owner
404.7925
442.6217
hhsizel
675.8086
24.24222
27.88 0.00
628.2585
723.3587
hhsize2
788.6606
36.47628
21.62
717.1138
860.2073
hhsize)
993.6609
58.63294
16.95
e.000
878.6548
1108.667
Expert Solution
This question has been solved!
Explore an expertly crafted, step-by-step solution for a thorough understanding of key concepts.
Step by stepSolved in 2 steps with 1 images

Knowledge Booster
Similar questions
- Use the following ANOVA table for regression to answer the questions. Analysis of Variance Source DF SS MS F P Regression 1 291.4 291.4 2.01 0.158 Residual Error 174 25230.0 145.0 Total 175 25521.4 Give the F-statistic and p-value.Enter the exact answers.The F-statistic is =The p-value is =arrow_forwardA paint company has large outlet stores in two cities. Ten samples of the weekly sales (in tons) for the two cities are as follows. City A: n = 10, X10 = 148.5, S1 = = 4.3. City B: n = 10, Y 10 = 144.2, S2 = 3.8. At a = 0.05 level of significance, test if the weekly sales are different. The following ¨answers" have been proposed. (a) The null hypothesis is that the weekly sales are the same and the alternative is that the they are not the same. By using an F test, we reject the null hypothesis. (b) The null hypothesis is that the weekly sales are the same and the alternative is that the they are not the same. By using an F test, we do not reject the null hypothesis. (c) The null hypothesis is that the weekly sales are the same and the alternative is that the they are not the same. By using a i test, we do not reject the null hypothesis. (d) The null hypothesis is that the weekly sales are the same and the alternative is that the they are not the same. By using a i test, we reject the…arrow_forwardThis research was conducted with Korean adolescents in the Los Angeles area. Would you be willing to generalize the results of this study to Korean adolescents who live in other regions of the country? Why or why not.arrow_forward
- You suspect that your east-facing portion of your Macintosh apple orchard is producing less apples than your west facing portion. You decide to conduct a study of your apple trees to determine the average production of apples per tree as measured in bushels for both sections. Conduct a hypothesis test at 5% level of significance to determine if the East facing section is producing significantly less apples per tree compared to the West facing section. Use the table below. Sample size Average amount of Standard of trees deviation Bushels West 55 28 East 50 22 12 What is the p-value? p=0.0021 0.025arrow_forwardConsider the following ANOVA table for a multiple regression model relating housing prices (in thousands of dollars) to the number of bedrooms in the house and the size of the lot on which the house was built (in square feet). There were 9090 total observations. Estimated Price=20,160.07+2188.83(Bedrooms)+0.2139(Lot Size)Estimated Price=20,160.07+2188.83(Bedrooms)+0.2139(Lot Size) ANOVA dfdf SSSS MSMS F� Significance F� Regression 22 306,443.7975306,443.7975 153,221.8988153,221.8988 21.727421.7274 2.2211E-082.2211E-08 Residual 8787 613,525.5190613,525.5190 7052.01757052.0175 Total 8989 919,969.3165919,969.3165 What percent of variation in housing prices is explained by the number of bedrooms and lot size? Round your answer to two decimal placesarrow_forwardChoose the appropriate statistical test. When computing, be sure to round each answer as indicated. A dentist wonders if depression affects ratings of tooth pain. In the general population, using a scale of 1-10 with higher values indicating more pain, the average pain rating for patients with toothaches is 6.8. A sample of 30 patients that show high levels of depression have an average pain rating of 7.1 (variance 0.8). What should the dentist determine? 1. Calculate the estimated standard error. (round to 3 decimals). [st.error] 2. What is thet-obtained? (round to 3 decimals). 3. What is the t-cv? (exact value) 4. What is your conclusion? Only type "Reject" or Retain"arrow_forwardConsider the following ANOVA table below. Some parts are blank intentionally. The number of observations is 249. Source Model (Regression) Residual (Error) Total The MSE is: SS 1,332 DF MS 921 Round your answer to two decimal places.arrow_forwardInterpret this statistic. Why was gamma applicable here? Please show your work.arrow_forwardarrow_back_iosarrow_forward_ios
Recommended textbooks for you
 MATLAB: An Introduction with ApplicationsStatisticsISBN:9781119256830Author:Amos GilatPublisher:John Wiley & Sons Inc
 Probability and Statistics for Engineering and th...StatisticsISBN:9781305251809Author:Jay L. DevorePublisher:Cengage Learning
 Statistics for The Behavioral Sciences (MindTap C...StatisticsISBN:9781305504912Author:Frederick J Gravetter, Larry B. WallnauPublisher:Cengage Learning
 Elementary Statistics: Picturing the World (7th E...StatisticsISBN:9780134683416Author:Ron Larson, Betsy FarberPublisher:PEARSON
 The Basic Practice of StatisticsStatisticsISBN:9781319042578Author:David S. Moore, William I. Notz, Michael A. FlignerPublisher:W. H. Freeman
 Introduction to the Practice of StatisticsStatisticsISBN:9781319013387Author:David S. Moore, George P. McCabe, Bruce A. CraigPublisher:W. H. Freeman

MATLAB: An Introduction with Applications
Statistics
ISBN:9781119256830
Author:Amos Gilat
Publisher:John Wiley & Sons Inc

Probability and Statistics for Engineering and th...
Statistics
ISBN:9781305251809
Author:Jay L. Devore
Publisher:Cengage Learning

Statistics for The Behavioral Sciences (MindTap C...
Statistics
ISBN:9781305504912
Author:Frederick J Gravetter, Larry B. Wallnau
Publisher:Cengage Learning

Elementary Statistics: Picturing the World (7th E...
Statistics
ISBN:9780134683416
Author:Ron Larson, Betsy Farber
Publisher:PEARSON

The Basic Practice of Statistics
Statistics
ISBN:9781319042578
Author:David S. Moore, William I. Notz, Michael A. Fligner
Publisher:W. H. Freeman

Introduction to the Practice of Statistics
Statistics
ISBN:9781319013387
Author:David S. Moore, George P. McCabe, Bruce A. Craig
Publisher:W. H. Freeman