MATLAB: An Introduction with Applications
6th Edition
ISBN: 9781119256830
Author: Amos Gilat
Publisher: John Wiley & Sons Inc
expand_more
expand_more
format_list_bulleted
Concept explainers
Topic Video
Question


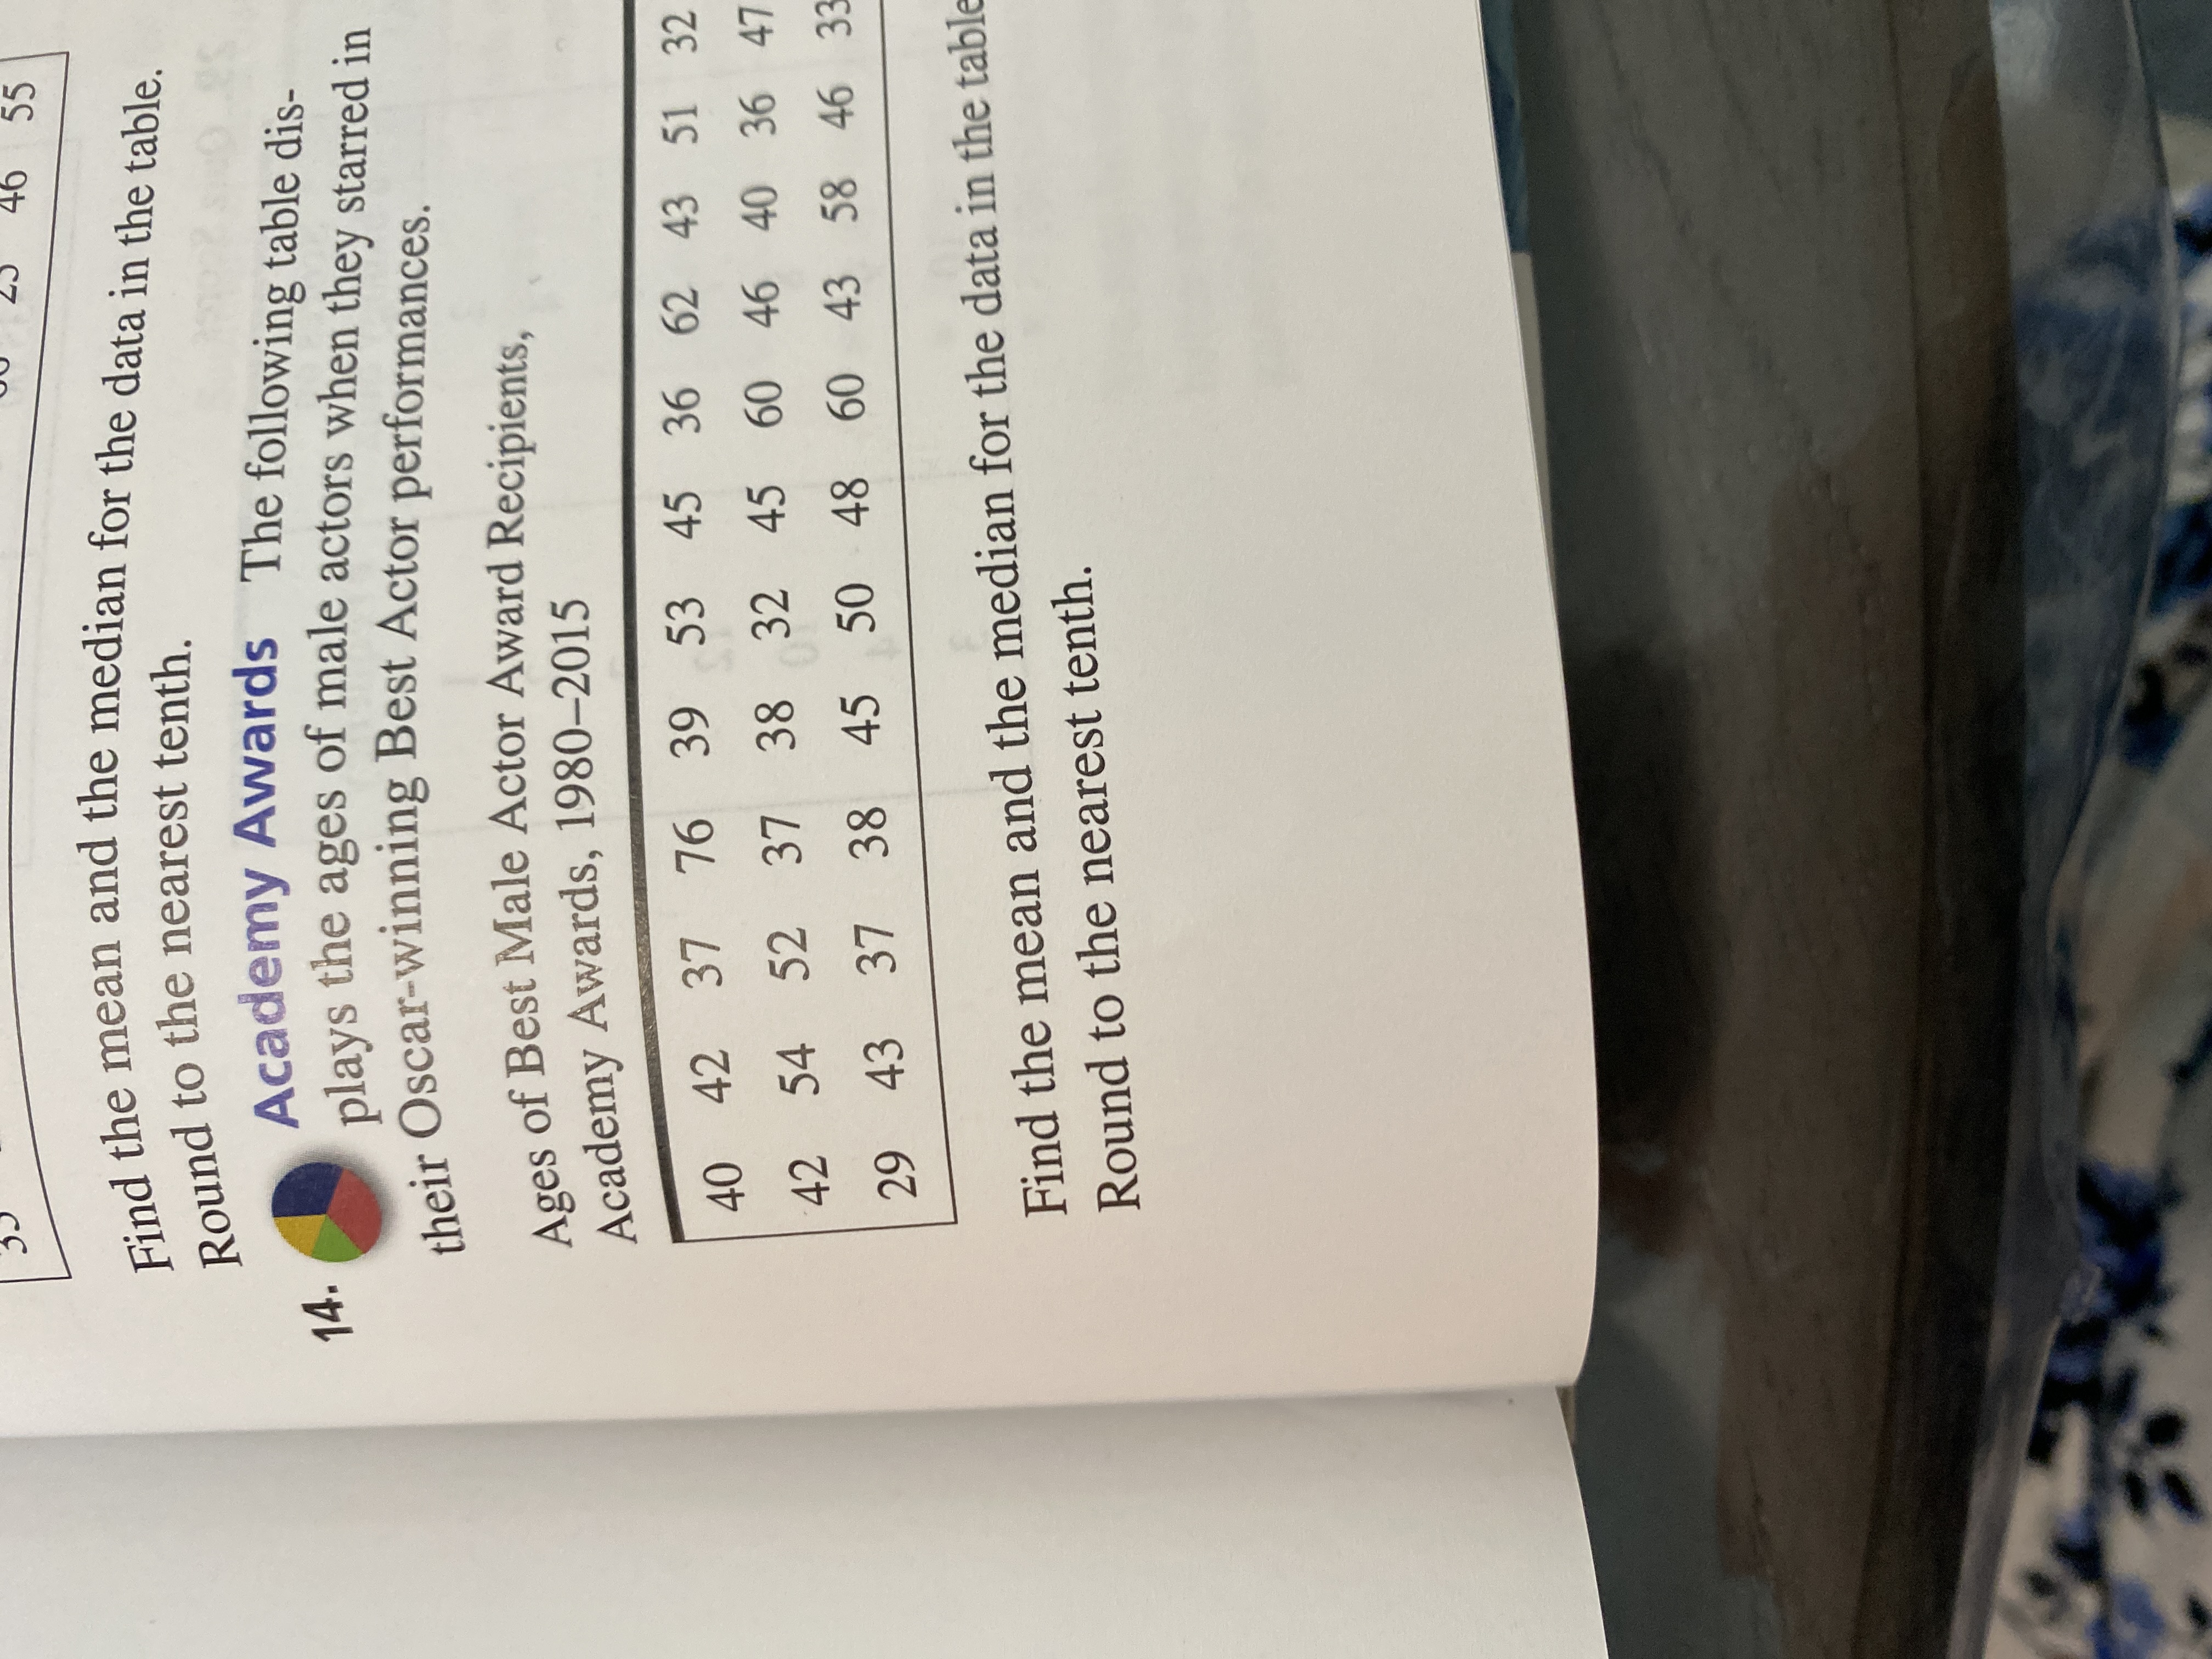
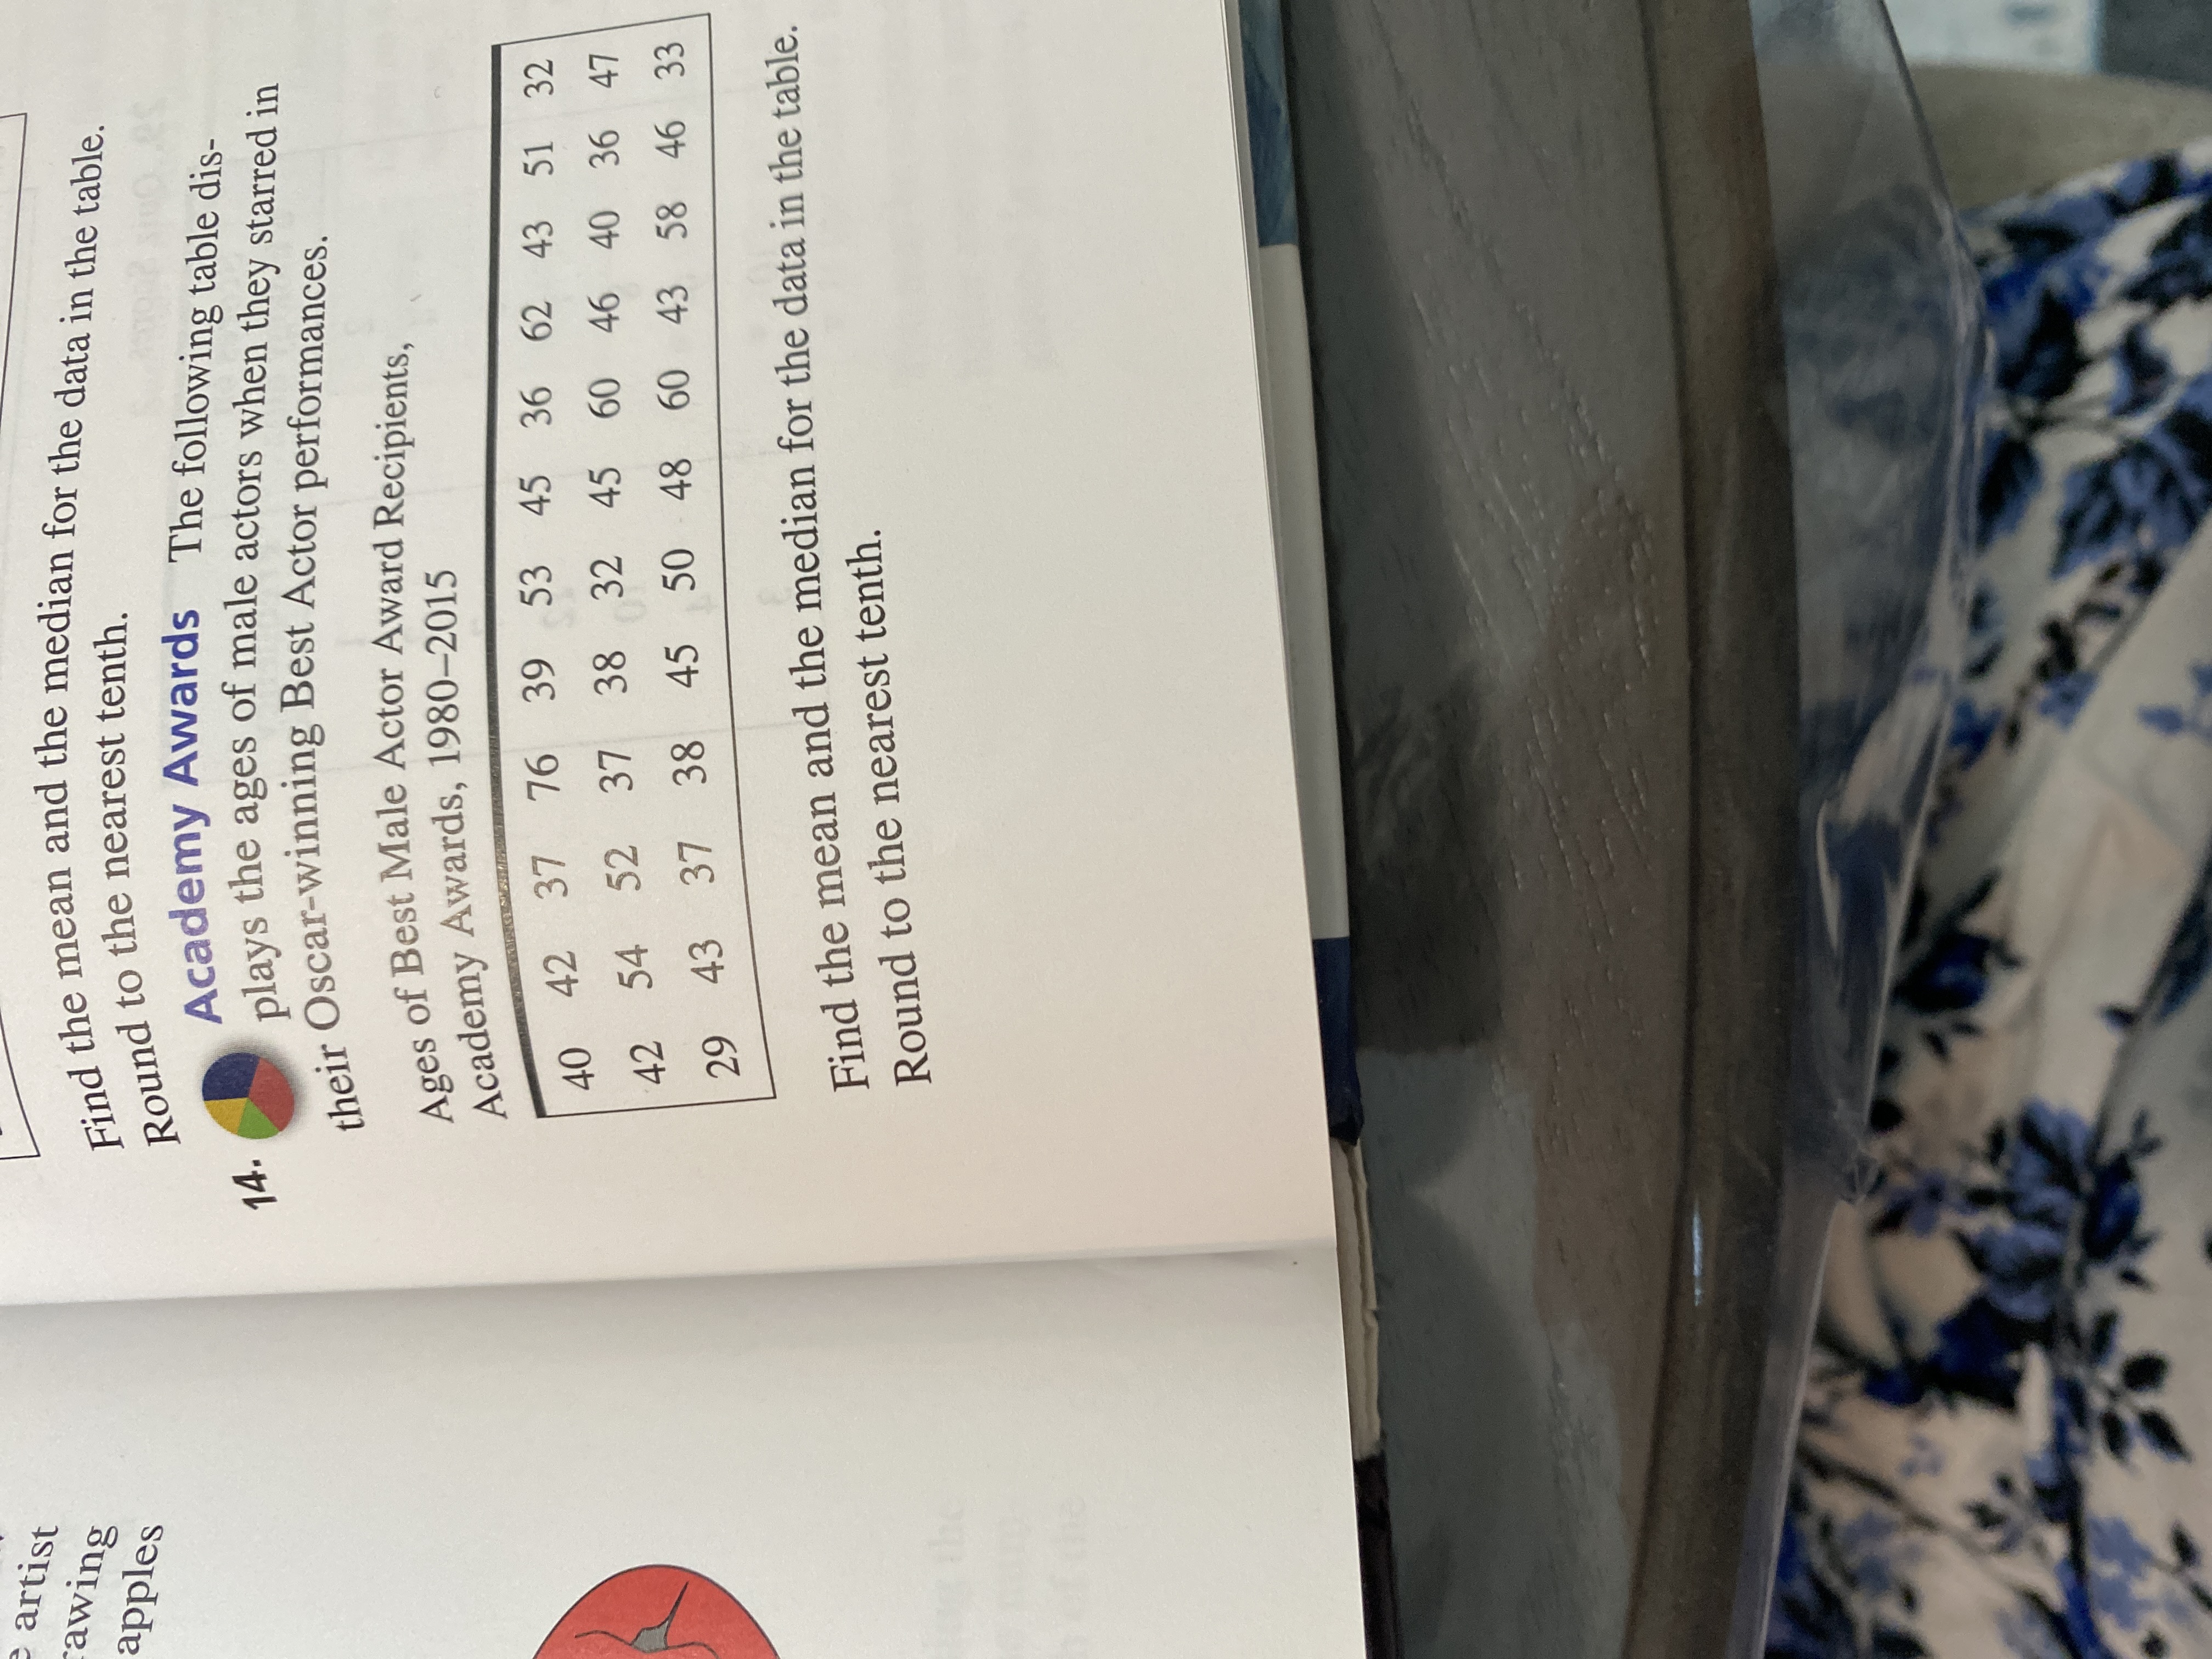
Transcribed Image Text:Academy Awards The following table dis-
plays the ages of male actors when they starred in
their Oscar-winning Best Actor performances.
Ages of Best Male Actor Award Recipients,
Academy Awards, 1980-2015
40 42 37 76 39 53 45 36
12 54 52 37 38 32 45 60 46 40 36 47
62 43 51 32
42
29 43
37 38 45 50 48
60 43 58 46 33
Find the mean and the median for the data in the table.
Round to the nearest tenth.
Expert Solution
This question has been solved!
Explore an expertly crafted, step-by-step solution for a thorough understanding of key concepts.
This is a popular solution
Trending nowThis is a popular solution!
Step by stepSolved in 3 steps with 3 images

Knowledge Booster
Learn more about
Need a deep-dive on the concept behind this application? Look no further. Learn more about this topic, statistics and related others by exploring similar questions and additional content below.Similar questions
- The data below show the number of attorneys employed by the ten largest law firms in Pittsburgh. 22 66 94 49 28 43 66 91 38 86 For the above data set, find the mean, median, midrange, and mode. Round to one decimal place, if necessary. Part: 0/4arrow_forwardThe table shows, for four cruises, the numbers of crew members, passengers, and entertainers (not included as passengers). Find (a) the mean and (b) the median total number of persons per cruise. Cruise Cruise 1 Cruise 2 Cruise 3 Cruise 4 Crew Passengers 1600 3400 1300 2500 183 225 177 213 Entertainers 40 75 10 55arrow_forwardThe accompanying data set lists diastolic blood pressure measurements (mm Hg) of females. All of the values are even numbers. Construct a stemplot. Identify the two values that are closest to the middle when the data are sorted in order from lowest to highest. (These values are often used to find the median.) 84 86 76 84 74 60 72 775 70 68 66 68 64 84 94 92 62 76 66 68 66 76 68 80 72 Construct the stemplot.arrow_forward
- A local travel office has 10 employees. Their monthly salaries are given below. $1520, $1730, $1690, $1100, $1420, $1560, $1830, $1350, $2800, $5500 ... (a) Find the mean. The mean is $arrow_forwardWe are going to calculate the mean, median, and mode for two sets of data. Please show your answer to one decimal place if necessary.Here is the first data set. 48 78 53 22 45 42 61 97 87 22 54 what is the mean (¯xx¯) of this data set? What is the median of this data set? What is the mode of this data set? Here is the second data set. 49 84 44 89 74 26 80 39 92 49 What is the mean (¯xx¯) of this data set? What is the median of this data set? What is the mode of this data set?arrow_forwardresearcher would like to examine the effect of fertilizer on flower growth. She obtains several flowers. She randomly assigns half the plants to the no fertilizer condition. The other half of the plants receive fertilizer. She monitors their growth for a month. She then compares the amount of growth of the two sets of plants. Is there a difference in growth between the no fertilizer and the fertilizer conditions? Use the .05 level of significance. In addition, find Cohen’s d and state what the effect size is in a sentence. Growth Rating No Fertilizer 40,21,27,30, 47 Fertilizer 46,25, 24, 38, 53arrow_forward
- A researcher randomly purchases several different kits of a popular building toy. The following table shows the number of pieces in each kit in the sample. Find the mean of the data. Round your answer to the nearest hundredth, if necessary. Building Toy Pieces 152 37 257 342 342 37 96 288 257 101 162 200 Copy Dataarrow_forwardFind the (a) mean, (b) median, (c) mode, and (d) midrange for the data and then (e) answer the given question. Listed below are the jersey numbers of 11 players randomly selected from the roster of a championship sports team. What do the results tell us? 61 51 5 73 85 37 41 6 59 82 18 a. Find the mean. b. Find the median. c. Find the mode. d. Find the midrange. e. What do the results tell us?arrow_forwardII On Friday night, the owner of Chez Pierre in downtown Chicago noted the amount spent for dinner for 28 four-person tables. 95 103 109 114 113 107 10 OLT 104 08 134 124 105 84 176 115 69 68 95 108 61 091 87 128 95 61 150 52 136 E Click here for the Excel Data File (a) Find the mean, median, and mode. (Round your answers to 2 decimal places.) Descriptive Statistics Data Count Mean Median Mode (b) Are the data symmetric or skewed? If skewed, which direction? O Symmetric O Skewed left O Skewed right Graw 11!H < Prev 10 of 19 ....... 2 Type here to search < įXƏNarrow_forward
- An auto dealer’s sales numbers are shown in the table below. Find the mean price for the cars sold in June. Number sold Price June July August $25,000 21 23 24 $20,000 35 32 37 $15,000 47 51 44arrow_forwardThe mean age of two people in a room is 20 years. A 50 year old person enters the room. What is the mean age of the 3 people in the room now 20 30 33.3 35 none of the abovearrow_forwardThe top 16 winning scores for NFL games are listed below. Find the mean score. Video Tutorial: How to find the mean on a TI-84 72 54 52 54 70 51 56 58 58 52 51 63 51 48 52 61 A. 54 B. 57.1 C. 63.2 D. 56.4arrow_forward
arrow_back_ios
SEE MORE QUESTIONS
arrow_forward_ios
Recommended textbooks for you
 MATLAB: An Introduction with ApplicationsStatisticsISBN:9781119256830Author:Amos GilatPublisher:John Wiley & Sons Inc
 Probability and Statistics for Engineering and th...StatisticsISBN:9781305251809Author:Jay L. DevorePublisher:Cengage Learning
 Statistics for The Behavioral Sciences (MindTap C...StatisticsISBN:9781305504912Author:Frederick J Gravetter, Larry B. WallnauPublisher:Cengage Learning
 Elementary Statistics: Picturing the World (7th E...StatisticsISBN:9780134683416Author:Ron Larson, Betsy FarberPublisher:PEARSON
 The Basic Practice of StatisticsStatisticsISBN:9781319042578Author:David S. Moore, William I. Notz, Michael A. FlignerPublisher:W. H. Freeman
 Introduction to the Practice of StatisticsStatisticsISBN:9781319013387Author:David S. Moore, George P. McCabe, Bruce A. CraigPublisher:W. H. Freeman

MATLAB: An Introduction with Applications
Statistics
ISBN:9781119256830
Author:Amos Gilat
Publisher:John Wiley & Sons Inc

Probability and Statistics for Engineering and th...
Statistics
ISBN:9781305251809
Author:Jay L. Devore
Publisher:Cengage Learning

Statistics for The Behavioral Sciences (MindTap C...
Statistics
ISBN:9781305504912
Author:Frederick J Gravetter, Larry B. Wallnau
Publisher:Cengage Learning

Elementary Statistics: Picturing the World (7th E...
Statistics
ISBN:9780134683416
Author:Ron Larson, Betsy Farber
Publisher:PEARSON

The Basic Practice of Statistics
Statistics
ISBN:9781319042578
Author:David S. Moore, William I. Notz, Michael A. Fligner
Publisher:W. H. Freeman

Introduction to the Practice of Statistics
Statistics
ISBN:9781319013387
Author:David S. Moore, George P. McCabe, Bruce A. Craig
Publisher:W. H. Freeman