
MATLAB: An Introduction with Applications
6th Edition
ISBN: 9781119256830
Author: Amos Gilat
Publisher: John Wiley & Sons Inc
expand_more
expand_more
format_list_bulleted
Related questions
Concept explainers
Question

Transcribed Image Text:ability. Lea
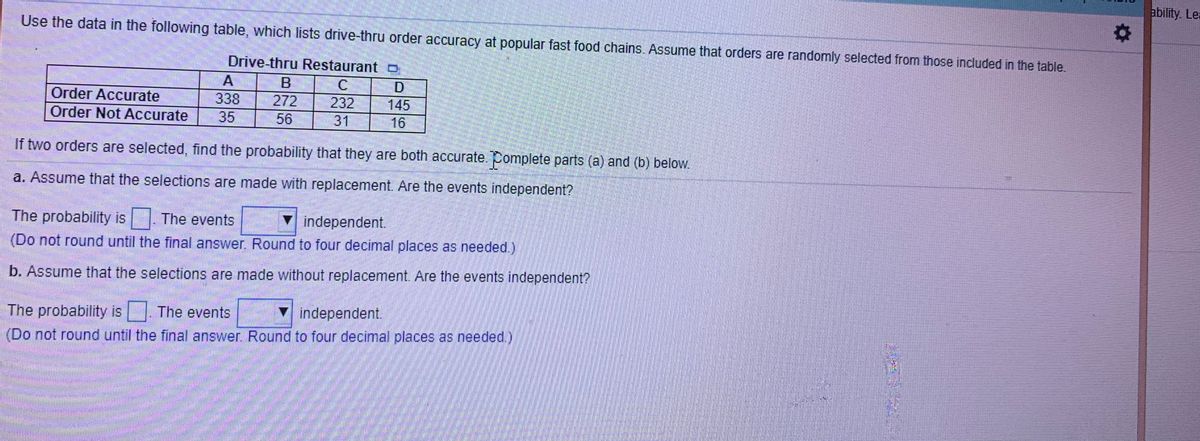
Use the data in the following table, which lists drive-thru order accuracy at popular fast food chains. Assume that orders are randomly selected from those included in the table.
Drive-thru Restaurant o
B
Order Accurate
338
272
232
145
Order Not Accurate
35
56
31
16
If two orders are selected, find the probability that they are both accurate. Complete parts (a) and (b) below.
a. Assume that the selections are made with replacement. Are the events independent?
The probability is. The events
V independent.
(Do not round until the final answer. Round to four decimal places as needed.)
b. Assume that the selections are made without replacement Are the events independent?
The probability is The events
V independent.
(Do not round until the final answer. Round to four decimal places as needed.)
Expert Solution
This question has been solved!
Explore an expertly crafted, step-by-step solution for a thorough understanding of key concepts.

This is a popular solution

Trending nowThis is a popular solution!

Step by stepSolved in 2 steps with 2 images

Knowledge Booster


Learn more about
Need a deep-dive on the concept behind this application? Look no further. Learn more about this topic, statistics and related others by exploring similar questions and additional content below.Similar questions
- Determine whether the statement is true or false. If it is false, rewrite it as a true statement. As the size of a sample increases, the mean of the distribution of sample means increases. Choose the correct answer below. O A. False. As the size of a sample increases, the mean of the distribution of sample means decreases. B. False. As the size of a sample increases, the mean of the distribution of sample means does not change. O C. True.arrow_forwardThe weights (to the nearest five pounds) of 30 randomly selected male college students are organized in the histogram. Use the graph to find the median weight. The median weight is pounds. (Type an integer or a decimal.) C Students (frequency) Number 10- 8+ 6- 4- Weight of 30 Male College Students 110 115 120 125 130 135 140 145 150 155 160 165 Weight (pounds) ONarrow_forwardUse the RAND function to assign random numbers to each observation. Then copy the 2 columns and paste them to the right. Then sort the data by the random number. Observation - 91,32,36,70,93,42,65,80,68,73,52,29,95,55,94,46,92,49,4,66,21,97arrow_forward
- The data represent the time, in minutes, spent reading a political blog in a day. Construct a frequency distribution using 5 classes. In the table, include the midpoints, relative frequencies, and cumulative frequencies. Which class has the greatest frequency and which has the least frequency? 20 22 29 2 3 19 19 4 10 20 29 13 25 17 28 22 4 13 0 9arrow_forwardTrying to determine the number of students to accept is a tricky task for universities. The Admissions staff at a small private college wants to use data from the past few years to predict the number of students enrolling in the university from those who are accepted by the university. The data are provided in the following table. R F eTextbook and Media Save for Late O % 5 T O >> G H (9) 2 Number Accepted Number Enrolled Find the correlation between the number of students accepted and enrolled. Use two decimal places in your answer. & 2,440 2,800 2,720 2,360 2,660 2,620 8 6 611 K 708 637 584 614 625 ( 9 L Attempts: 0 of 1 used ) 0 P Submit Answer 56°F Cl Backspaarrow_forwardA. Refer to the data and solve for the required measures of position. The following are the grades of 25 students in the first marking period of their Calculus I class. 65, 68, 70, 71, 73, 75, 75, 76, 78, 78, 79, 80, 83, 85, 87, 88, 89, 90, 90, 91, 93, 94, 95, 95, 97arrow_forward
- R A veterinarian recorded how many kittens were born in each litter. This data is summarized in the L histogram below. (Note: The last class actually represents "7 or more kittens," not just 7 kittens.) 14 12 10- 8- 6- 4 1 2 3 4 7 8 # of kittens What is the frequency of litters having at most 3 kittens? ans = Fe Ro 1 FEB 18 P. W MacBook Air 20 000 esc F5 F6 F2 F3 F4 F1 & ! @ 1 2 4 5 Q W R %24 # 3 6 2. Frequencyarrow_forwardHere is a set of data. 2 41 92 342 353 420 512 551 585 706 776 951 Identify the 5 number summary (min, Q1, median, Q3, max) ___, __, __, __, __arrow_forward
arrow_back_ios
arrow_forward_ios
Recommended textbooks for you
- MATLAB: An Introduction with ApplicationsStatisticsISBN:9781119256830Author:Amos GilatPublisher:John Wiley & Sons Inc
 Probability and Statistics for Engineering and th...StatisticsISBN:9781305251809Author:Jay L. DevorePublisher:Cengage Learning
 Statistics for The Behavioral Sciences (MindTap C...StatisticsISBN:9781305504912Author:Frederick J Gravetter, Larry B. WallnauPublisher:Cengage Learning
  Elementary Statistics: Picturing the World (7th E...StatisticsISBN:9780134683416Author:Ron Larson, Betsy FarberPublisher:PEARSON
 The Basic Practice of StatisticsStatisticsISBN:9781319042578Author:David S. Moore, William I. Notz, Michael A. FlignerPublisher:W. H. Freeman
 Introduction to the Practice of StatisticsStatisticsISBN:9781319013387Author:David S. Moore, George P. McCabe, Bruce A. CraigPublisher:W. H. Freeman
MATLAB: An Introduction with Applications
Statistics
ISBN:9781119256830
Author:Amos Gilat
Publisher:John Wiley & Sons Inc
Probability and Statistics for Engineering and th...
Statistics
ISBN:9781305251809
Author:Jay L. Devore
Publisher:Cengage Learning
Statistics for The Behavioral Sciences (MindTap C...
Statistics
ISBN:9781305504912
Author:Frederick J Gravetter, Larry B. Wallnau
Publisher:Cengage Learning
Elementary Statistics: Picturing the World (7th E...
Statistics
ISBN:9780134683416
Author:Ron Larson, Betsy Farber
Publisher:PEARSON
The Basic Practice of Statistics
Statistics
ISBN:9781319042578
Author:David S. Moore, William I. Notz, Michael A. Fligner
Publisher:W. H. Freeman
Introduction to the Practice of Statistics
Statistics
ISBN:9781319013387
Author:David S. Moore, George P. McCabe, Bruce A. Craig
Publisher:W. H. Freeman