
MATLAB: An Introduction with Applications
6th Edition
ISBN: 9781119256830
Author: Amos Gilat
Publisher: John Wiley & Sons Inc
expand_more
expand_more
format_list_bulleted
Related questions
Question
Please use the 5 steps:
Step 1: State null & alternate hypothesis
Step 2: Select a level of significance
Step 3: Identify the test statistic
Step 4: Formulate a decision rule
Step 5: Take a sample to arrive at a decision (Reject or do not reject null hypothesis)
Please answer 2-5 only
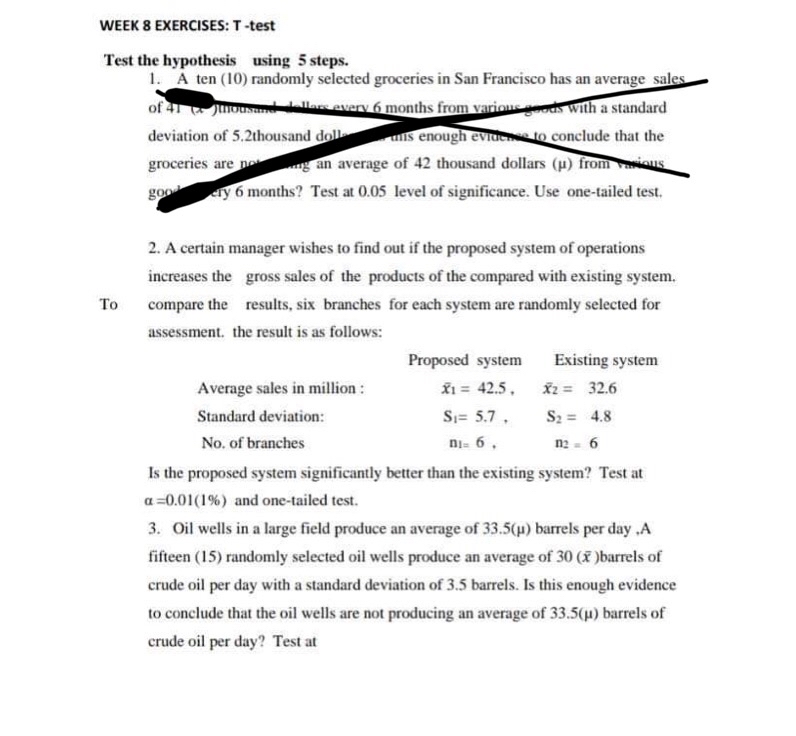

Transcribed Image Text:WEEK 8 EXERCISES: T-test
Test the hypothesis using 5 steps.
1. A ten (10) randomly selected groceries in San Francisco has an average sales
of 41 Junousand dollars every 6 months from various goods with a standard
deviation of 5.2thousand doll
is enough evidence to conclude that the
groceries are not
an average of 42 thousand dollars (μ) from sous
goo
ery 6 months? Test at 0.05 level of significance. Use one-tailed test.
To
2. A certain manager wishes to find out if the proposed system of operations
increases the gross sales of the products of the compared with existing system.
compare the results, six branches for each system are randomly selected for
assessment, the result is as follows:
Proposed system
x₁ = 42.5,
X2 = 32.6
S₁= 5.7.
S₂= 4.8
ni= 6,
112= 6
Is the proposed system significantly better than the existing system? Test at
a=0.01 (1%) and one-tailed test.
Existing system
Average sales in million:
Standard deviation:
No. of branches
3. Oil wells in a large field produce an average of 33.5(µ) barrels per day,A
fifteen (15) randomly selected oil wells produce an average of 30 (x)barrels of
crude oil per day with a standard deviation of 3.5 barrels. Is this enough evidence
to conclude that the oil wells are not producing an average of 33.5(µ) barrels of
crude oil per day? Test at

Transcribed Image Text:a=0.1, level of significance. Use two-tailed test
4. In an attempt to compare the performance of students with more than one
personal electronic gadgets and those with no or only one personal electronic
gadget, The mean grade in one term and the standard deviation are shown in
the table:
Students with personal
electronic gadgets
0-1
>1
Mean
x₁ = 83
x₂ = 79
Standard
Deviation
Mean
Si=10
S₂ = 14
X₁ = 83
X2 = 79
Is there a significant difference in the mean grades of students with one or no personal
electronic gadget and those with more than one personal electronic gadgets? @ a = 0.05
and two-tailed test.
5. Perform Exercise no. 2, assuming one-tailed test, @a= 0.01 and n₁ = 15.
Students with personal
electronic gadgets
0-1
>1
sample
Standard
Deviation
n₁ = 12
m2 =12
Si= 10
S₂= 14
n₁ =15
n₂ = 12
Expert Solution
This question has been solved!
Explore an expertly crafted, step-by-step solution for a thorough understanding of key concepts.

Step by stepSolved in 4 steps with 4 images

Knowledge Booster

Similar questions
- Typed plz and asap please provide a quality solution for better rating and maintain accuracy in solution and take care of plagiarismarrow_forwardStep 3 please and thank youarrow_forward40 people are randomly sent to walk one of four trails. The time (in minutes) they spend completing each trail is recorded in the table below. (a) Test to see if the times needed to complete a trail vary. Use a 0.05 significance level. (b) Test each pair (A/B, A/C, A/D, B/C, B/D, C/D) to see which trails have a statistically significant difference. Indicate your p-value for each comparison, and when the effect is statistically significant (use 0.05 as your significance level), declare which trail of the two takes more time to complete. Trail A - 30, 33, 41, 27, 36, 31, 37, 40, 29, 35 Trail B - 27, 33, 38, 41, 40, 38, 35, 44, 41, 39 Trail C - 25, 34, 41, 39, 32, 30, 36, 35, 27, 33 Trail D - 41, 39, 46, 37, 40, 42, 50, 42, 50, 33, 47, 43arrow_forward
- Does more education lower a person’s level of prejudice? The number of years of education and the score on a prejudice test for ten people is given in the following table. Higher scores on the test indicate more prejudice. Years of Education: 12, 15, 14, 13, 18, 10, 16, 12, 10, 4 Score of Prejudice Test: 1, 6, 2, 3, 2, 4, 1, 5, 5, 10 Conduct a hypothesis test to determine if there is a significant linear correlation between the two variables. If there is a significant linear correlation between the variables, determine the regression equation. There is a significant correlation between the variables and the regression equation is y' = 10.5 - 0.532x There is a significant correlation between the variables and the regression equation is y' = - 0.532 + 10.5x There is not a significant correlation between the variables, so the regression equation should not be determined. There is a significant correlation between the variables and the regression equation is y' = 16.509 - 1.054xarrow_forwardThe critical value in a hypothesis test Multiple Choice depends on the value of the test statistic. is calculated from the sample data. separates the acceptance and rejection regions. usually is .05 or .01 in most statistical tests.arrow_forwardI need the test static, critical value , null & alternative hypothesis , conclusion & also probably p value Thankyou so much I need help kn working these out.arrow_forward
- A study of seat belt users and nonusers yielded the randomly selected sample data summarized in the accompanying table. Use a 0.05 significance level to test the claim that the amount of smoking is independent of seat belt use. A plausible theory is that people who smoke are less concerned about their health and safety and are therefore less inclined to wear seat belts, Is this theory supported by the sample data? BB Click the icon to view the data table. Determine the null and alternative hypotheses. O A. Ho: The amount of smoking is dependent upon seat belt use. H₁: The amount of smoking is not dependent upon seat belt use. O B. Ho: Heavy smokers are not less likely than non-smokers to wear a seat belt. H₁: Heavy smokers are less likely than non-smokers to wear a seat belt. OC, Ho: Heavy smokers are less likely than non-smokers to wear a seat belt. H₁: Heavy smokers are not less likely than non-smokers to wear a seat belt. O D. Ho: The amount of smoking is independent of seat belt…arrow_forwardDescribe two advantages a repeated measures t-test has over an independent sample t -test study design. Give an example of a study where a repeated measures design would be appropriatearrow_forwardHelp pleasearrow_forward
arrow_back_ios
arrow_forward_ios
Recommended textbooks for you
- MATLAB: An Introduction with ApplicationsStatisticsISBN:9781119256830Author:Amos GilatPublisher:John Wiley & Sons Inc
 Probability and Statistics for Engineering and th...StatisticsISBN:9781305251809Author:Jay L. DevorePublisher:Cengage Learning
 Statistics for The Behavioral Sciences (MindTap C...StatisticsISBN:9781305504912Author:Frederick J Gravetter, Larry B. WallnauPublisher:Cengage Learning
  Elementary Statistics: Picturing the World (7th E...StatisticsISBN:9780134683416Author:Ron Larson, Betsy FarberPublisher:PEARSON
 The Basic Practice of StatisticsStatisticsISBN:9781319042578Author:David S. Moore, William I. Notz, Michael A. FlignerPublisher:W. H. Freeman
 Introduction to the Practice of StatisticsStatisticsISBN:9781319013387Author:David S. Moore, George P. McCabe, Bruce A. CraigPublisher:W. H. Freeman
MATLAB: An Introduction with Applications
Statistics
ISBN:9781119256830
Author:Amos Gilat
Publisher:John Wiley & Sons Inc
Probability and Statistics for Engineering and th...
Statistics
ISBN:9781305251809
Author:Jay L. Devore
Publisher:Cengage Learning
Statistics for The Behavioral Sciences (MindTap C...
Statistics
ISBN:9781305504912
Author:Frederick J Gravetter, Larry B. Wallnau
Publisher:Cengage Learning
Elementary Statistics: Picturing the World (7th E...
Statistics
ISBN:9780134683416
Author:Ron Larson, Betsy Farber
Publisher:PEARSON
The Basic Practice of Statistics
Statistics
ISBN:9781319042578
Author:David S. Moore, William I. Notz, Michael A. Fligner
Publisher:W. H. Freeman
Introduction to the Practice of Statistics
Statistics
ISBN:9781319013387
Author:David S. Moore, George P. McCabe, Bruce A. Craig
Publisher:W. H. Freeman