
MATLAB: An Introduction with Applications
6th Edition
ISBN: 9781119256830
Author: Amos Gilat
Publisher: John Wiley & Sons Inc
expand_more
expand_more
format_list_bulleted
Related questions
Question
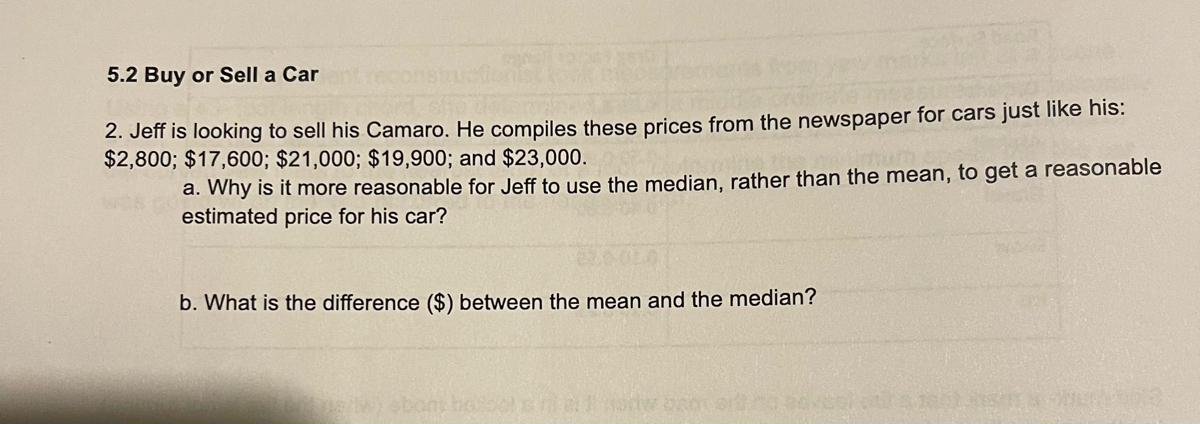

Transcribed Image Text:5.2 Buy or Sell a Car
2. Jeff is looking to sell his Camaro. He compiles these prices from the newspaper for cars just like his:
$2,800; $17,600; $21,000; $19,900; and $23,000.
a. Why is it more reasonable for Jeff to use the median, rather than the mean, to get a reasonable
estimated price for his car?
b. What is the difference ($) between the mean and the median?
How bror ort
SIT
Expert Solution
This question has been solved!
Explore an expertly crafted, step-by-step solution for a thorough understanding of key concepts.

This is a popular solution

Trending nowThis is a popular solution!

Step by stepSolved in 4 steps

Knowledge Booster

Similar questions
- The mean purchase total is $93.80 and the median purchase total is $75.80. The store manager investigates and learns that the customer that made a $500 purchase had not purchased groceries, but rather a $500 gift card. Because this customer's purchase was not typical, the manager decides to exclude this total from the data set. How will removing the $500 purchase from the data set affect the value of the mean and the median?arrow_forwardThe line drawn within the box of the box-and-whisker plot represents the mean. TRUE FALSEarrow_forwardd. equals the national mean of $55.4 thousand.e. exceeds the national mean of $55.4 thousand.arrow_forward
- You saw back in Chapter 2 that the mean, median, mode, and midrange are used to indicate where data is centered in a data set, or in other words what a typical value in the set is. A question that is often asked is, "If they're all supposed to do the same thing, why is there more than one?" Isn't one enough? In this exercise, you will be given two small sets of data. For each set, a. find the mean, median, mode and midrange b. in your opinion, decide which of the measures BEST represents all the values in the set (best indicates a typical value), and which one does this the WORST. c. post your responses and justify them by explaining why Don't forget to respond to at least one of your classmate's posts. With this exercise, "more is better." I'll elaborate after the deadline. • Set A: the salaries of 10 employees at a company (in thousands of dollars): 50, 50, 50, 50, 50, 50, 50, 50, 50, 500 • Set B: the grades of 9 students on an exam: 20, 25, 30, 35, 40, 45, 100, 100, 100arrow_forwardA. What is the median? B. What is the mean? c. What is the precise median?arrow_forwardFor the following scores, calculate the mean, median, mode, and range. 2, 25, 22, 24, 22, 23arrow_forward
- What is the mean of .27, .63, .45, .25, .31, 1.15, .64, 1.33, 1.14, 0.41, 0.47arrow_forwardA business reports that their average salary is over $91,000, the simple mean of the salaries listed in the chart. Alternatively, instead of a simple mean, the business could report the median, or the mode. Which would be the most useful to someone deciding whether to apply for an entry level job at this business? Job Number of Employees Salary Line workers 10 $30,000 Office manager 1 $45,000 CEO 1 $200,000 Select one: a. Simple mean is best b. Simple mean and median are nearly equal numerically. They are equally good for this purpose and better than the other options. O c. Simple mean and mode are equally good for this purpose and better than the other options. d. Median and mode are about equally good for this purpose and better than other options.arrow_forwardIn a survey that asked individuals about their favorite styles of music, 37 replied rock, 27 said they preferred pop music, 14 stated they like classical music the most, and 3 individuals stated they preferred opera. Based on this data, what would be the mode? Why couldn’t the mean or median be used to describe this set of values?arrow_forward
- I need an answer for number 5arrow_forwardSuppose the mean miles per gallon for a sample of 70,000 new cars and light trucks sold in the United States in 2017 differs from the population mean by more than one gallon. How would you interpret this result?arrow_forwardAccording to the Department of Commerce, the mean and median prices of new houses sold in the United States in 1989 were $129,900 and 159,000. Which of these numbers is most likely the mean and which is the median?arrow_forward
arrow_back_ios
SEE MORE QUESTIONS
arrow_forward_ios
Recommended textbooks for you
- MATLAB: An Introduction with ApplicationsStatisticsISBN:9781119256830Author:Amos GilatPublisher:John Wiley & Sons Inc
 Probability and Statistics for Engineering and th...StatisticsISBN:9781305251809Author:Jay L. DevorePublisher:Cengage Learning
 Statistics for The Behavioral Sciences (MindTap C...StatisticsISBN:9781305504912Author:Frederick J Gravetter, Larry B. WallnauPublisher:Cengage Learning
  Elementary Statistics: Picturing the World (7th E...StatisticsISBN:9780134683416Author:Ron Larson, Betsy FarberPublisher:PEARSON
 The Basic Practice of StatisticsStatisticsISBN:9781319042578Author:David S. Moore, William I. Notz, Michael A. FlignerPublisher:W. H. Freeman
 Introduction to the Practice of StatisticsStatisticsISBN:9781319013387Author:David S. Moore, George P. McCabe, Bruce A. CraigPublisher:W. H. Freeman
MATLAB: An Introduction with Applications
Statistics
ISBN:9781119256830
Author:Amos Gilat
Publisher:John Wiley & Sons Inc
Probability and Statistics for Engineering and th...
Statistics
ISBN:9781305251809
Author:Jay L. Devore
Publisher:Cengage Learning
Statistics for The Behavioral Sciences (MindTap C...
Statistics
ISBN:9781305504912
Author:Frederick J Gravetter, Larry B. Wallnau
Publisher:Cengage Learning
Elementary Statistics: Picturing the World (7th E...
Statistics
ISBN:9780134683416
Author:Ron Larson, Betsy Farber
Publisher:PEARSON
The Basic Practice of Statistics
Statistics
ISBN:9781319042578
Author:David S. Moore, William I. Notz, Michael A. Fligner
Publisher:W. H. Freeman
Introduction to the Practice of Statistics
Statistics
ISBN:9781319013387
Author:David S. Moore, George P. McCabe, Bruce A. Craig
Publisher:W. H. Freeman