Concept explainers

Since you have posted a question with multiple sub-parts, we will solve first three sub-parts for you. To get remaining sub-part solved please repost the complete question and mention the sub-parts to be solved.
a.
Central limit theorem:
Based on central limit theorem, if the population is normally distributed then the sampling distribution is also normally distributed regardless of the sample size. If there is no information about the population, for sufficiently large sample size n≥30 sampling distribution of sample mean has the normal distribution.
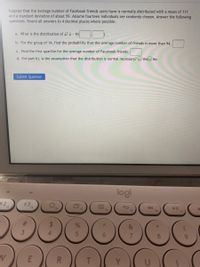
Let be the average number of Facebook friends users which follows normal distribution. The mean is 111 and standard deviation is 59. That is, .
The mean of the sampling distribution is,
The standard deviation of the sampling distribution is,
Thus, the distribution of is .
Step by stepSolved in 3 steps

- The average price of a college math textbook is $162 and the standard deviation is $27. Suppose that 10 textbooks are randomly chosen. Round all answers to 4 decimal places where possible. a. What is the distribution of ? ~ N( b. For the group of 10, find the probability that the average price is between $161 and $167. c. Find the 95th percentile for the average textbook price for this sample size. $ (round to the nearest cent) d. Find the 95th percentile for an individual textbook price. (round to the nearest cent) $ e. For part b), is the assumption that the distribution is normal necessary? YesO Noarrow_forwardTransforming an entire distribution of scores into z-scores will not change the shape of the distribution. a. True b. Falsearrow_forward5. (Solve using pen and paper) Cans of salmon are supposed to have a net weight of 6 oz. The canner says that the net weight is a random variable with mean m=6.05 oz. and stand. dev. s=.18 oz. Suppose you take a random sample of 36 cans and calculate the sample mean weight to be 5.97 oz. a. Find the probability that the mean weight of the sample is less than or equal to 5.97 oz.arrow_forward
- The first pic is the question. Since some tutors have been solving the problems wrong recently (no judgment), I’ve added a sample question to solve problem.arrow_forwardUsing the data attached, compute x-bar: 1. Define the random variable x-bar in words 2. state the estimated distribution to use. Use both words and symbols.arrow_forwardGiven the following distribution of scores: 2, 8, 2, 3, 6, 5, 7, 8, 4, 8, 2, 3 What is the mode of the distribution? Group of answer choices 2 8 Both 5 and 7 Both 2 and 8arrow_forward
 MATLAB: An Introduction with ApplicationsStatisticsISBN:9781119256830Author:Amos GilatPublisher:John Wiley & Sons Inc
 Probability and Statistics for Engineering and th...StatisticsISBN:9781305251809Author:Jay L. DevorePublisher:Cengage Learning
 Statistics for The Behavioral Sciences (MindTap C...StatisticsISBN:9781305504912Author:Frederick J Gravetter, Larry B. WallnauPublisher:Cengage Learning
 Elementary Statistics: Picturing the World (7th E...StatisticsISBN:9780134683416Author:Ron Larson, Betsy FarberPublisher:PEARSON
 The Basic Practice of StatisticsStatisticsISBN:9781319042578Author:David S. Moore, William I. Notz, Michael A. FlignerPublisher:W. H. Freeman
 Introduction to the Practice of StatisticsStatisticsISBN:9781319013387Author:David S. Moore, George P. McCabe, Bruce A. CraigPublisher:W. H. Freeman


