
MATLAB: An Introduction with Applications
6th Edition
ISBN: 9781119256830
Author: Amos Gilat
Publisher: John Wiley & Sons Inc
expand_more
expand_more
format_list_bulleted
Related questions
Concept explainers
Topic Video
Question
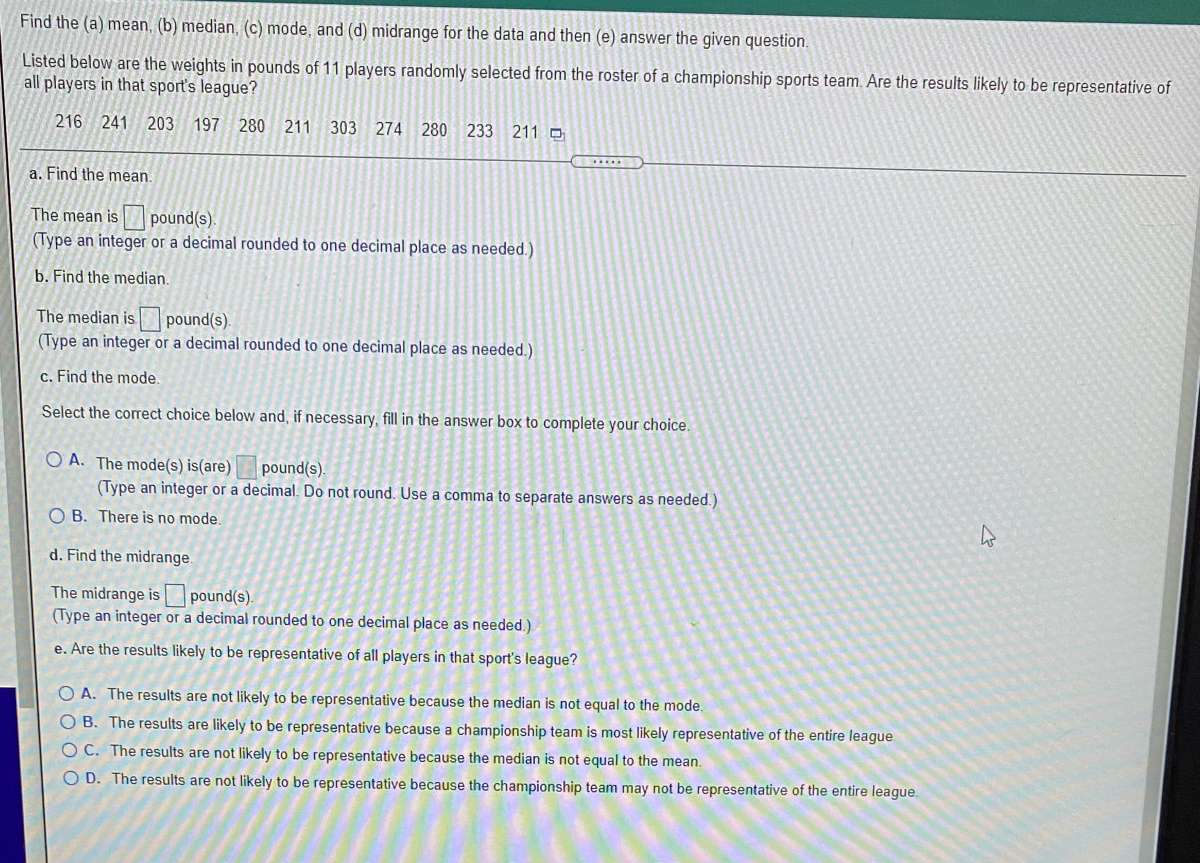

Transcribed Image Text:Find the (a) mean, (b) median, (c) mode, and (d) midrange for the data and then (e) answer the given question.
Listed below are the weights in pounds of 11 players randomly selected from the roster of a championship sports team. Are the results likely to be representative of
all players in that sport's league?
216 241
203 197
280 211 303 274 280 233 211 O
a. Find the mean.
The mean is pound(s).
(Type an integer or a decimal rounded to one decimal place as needed.)
b. Find the median.
The median is pound(s).
(Type an integer or a decimal rounded to one decimal place as needed.)
c. Find the mode.
Select the correct choice below and, if necessary, fill in the answer box to complete your choice.
O A. The mode(s) is(are)
(Type an integer or a decimal. Do not round. Use a comma to separate answers as needed.)
pound(s).
O B. There is no mode.
d. Find the midrange.
The midrange is pound(s).
(Type an integer or a decimal rounded to one decimal place as needed.)
e. Are the results likely to be representative of all players in that sport's league?
O A. The results are not likely to be representative because the median is not equal to the mode.
O B. The results are likely to be representative because a championship team is most likely representative of the entire league
OC. The results are not likely to be representative because the median is not equal to the mean.
O D. The results are not likely to be representative because the championship team may not be representative of the entire league.
Expert Solution
This question has been solved!
Explore an expertly crafted, step-by-step solution for a thorough understanding of key concepts.

Step by stepSolved in 2 steps with 1 images

Knowledge Booster


Learn more about
Need a deep-dive on the concept behind this application? Look no further. Learn more about this topic, statistics and related others by exploring similar questions and additional content below.Similar questions
- e SC A police officer recorded the following speeds of cars at a certain point on the highway: 55, 55, 49, 62, 68, 56, 55, 84, 52, 73, 58, 58 What was the median speed of the drivers? L A Moving to another question will save this response. MacBook Proarrow_forwardA = 11 B = 2 C= 2 D = 0 F = 1 105, 82, 94.5, 72.5, 92, 91, 52, 86, 100, 96, 98, 109, 96, 98, 95, 72arrow_forwardDraw a pictograph to represent the data displayed in the table below. Choose whatever symbol you like and be sure to include a key with the scale that you used. Subject Number of Students Math 16 Science 8. English 12 History 8. Art 4 Subject Number of Students Math Science English History Art Key:arrow_forward
- Educational data was recorded for 78 seventh graders. For the students' IQ, a boxplot was drawn, as shown below. 140-F 130+ 120+ 110+ 100 90 80 70Ł What is the interquartile range? o 64 O 50 o 15 o7.5arrow_forwardThe data below represent the responses to two questions asked in a survey of 40 college students majoring in business: What is your gender? (M = male; F= female) and What is your major? (A = Accounting: C= Computer Information Systems; M = Marketing). Complete parts (a) and (b). E Click the icon to view the data. (Simplify your answers. Round to one decimal place as needed.) Survey data Complete the following contingency table based on row percentages. Student Major Categories A Gender: Major: F M F F F M Gender M Totals M M A M A A A Male 40.9 % 27.3 % 31.8 % 100 % Gender: Major: F M M M M F Female 38.9 22.2 38.9 100 M C A M A Totals 40.0 25.0 35.0 100.0 Gender: F M A M M F M M A (Simplify your answers. Round to one decimal place as needed.) Major: A Complete the following contingency table based on column percentages. Gender: M F F F A Major: C A A M Student Major Categories A Gender M Totals Male % % Female Totals Print Done (Simplify your answers. Round to one decimal place as…arrow_forwardUse the birth weights (grams) of 50 babies from the data set "Births." Use software or a calculator to find the mean and median. Examine the list of birth weights to make an observation about those numbers. How does that observation affect the way that the results should be rounded? Click the icon to view the birth weight data. - X The mean birth weight is Birth weights (grams) grams. (Round to one decimal place as needed.) 300 4900 4000 3600 3400 3000 3700 2900 3700 3100 3400 3500 4100 3200 2900 2800 3500 3100 3300 3800 3800 2300 3300 2600 2400 3400 3300 4000 2800 3600 3100 2800 2800 2500 2600 2700 2600 3000 2900 3600 300 3400 3500 3400 3600 3400 3200 2600 3600 3500arrow_forward
- Find the mean, the median, and the mode of the following salaries of employees of the Moe D. Lawn Landscaping Company. (If an answer does not exist, enter DNE.) mean $ 31750 median $ 29500 mode $ DNE Salary Frequency $23,000 4 $29,000 3 $30,000 $45,000 1 PictureNt/Corbisarrow_forwardDetermine the level of measurement of the variable. a. an officer's rank in the military. (Captain, Major, Lieutenant Colonel, ...) a. weight of rice bought by a customer. b. a student's favorite sport. c. Number on the football player jersey. d. Temperaturearrow_forwardPrecision is a measure of -?-?arrow_forward
arrow_back_ios
arrow_forward_ios
Recommended textbooks for you
- MATLAB: An Introduction with ApplicationsStatisticsISBN:9781119256830Author:Amos GilatPublisher:John Wiley & Sons Inc
 Probability and Statistics for Engineering and th...StatisticsISBN:9781305251809Author:Jay L. DevorePublisher:Cengage Learning
 Statistics for The Behavioral Sciences (MindTap C...StatisticsISBN:9781305504912Author:Frederick J Gravetter, Larry B. WallnauPublisher:Cengage Learning
  Elementary Statistics: Picturing the World (7th E...StatisticsISBN:9780134683416Author:Ron Larson, Betsy FarberPublisher:PEARSON
 The Basic Practice of StatisticsStatisticsISBN:9781319042578Author:David S. Moore, William I. Notz, Michael A. FlignerPublisher:W. H. Freeman
 Introduction to the Practice of StatisticsStatisticsISBN:9781319013387Author:David S. Moore, George P. McCabe, Bruce A. CraigPublisher:W. H. Freeman
MATLAB: An Introduction with Applications
Statistics
ISBN:9781119256830
Author:Amos Gilat
Publisher:John Wiley & Sons Inc
Probability and Statistics for Engineering and th...
Statistics
ISBN:9781305251809
Author:Jay L. Devore
Publisher:Cengage Learning
Statistics for The Behavioral Sciences (MindTap C...
Statistics
ISBN:9781305504912
Author:Frederick J Gravetter, Larry B. Wallnau
Publisher:Cengage Learning
Elementary Statistics: Picturing the World (7th E...
Statistics
ISBN:9780134683416
Author:Ron Larson, Betsy Farber
Publisher:PEARSON
The Basic Practice of Statistics
Statistics
ISBN:9781319042578
Author:David S. Moore, William I. Notz, Michael A. Fligner
Publisher:W. H. Freeman
Introduction to the Practice of Statistics
Statistics
ISBN:9781319013387
Author:David S. Moore, George P. McCabe, Bruce A. Craig
Publisher:W. H. Freeman