
MATLAB: An Introduction with Applications
6th Edition
ISBN: 9781119256830
Author: Amos Gilat
Publisher: John Wiley & Sons Inc
expand_more
expand_more
format_list_bulleted
Related questions
Question
a. Find the 3rd quartile , 72nd percentile, and the 8th decile of the set of data.
b. What is the percentile rank of Dennis and Christine?
c. Based on their percentile and percentile ranks, will Dennis and Christine receive a scholarship? Explain your answer...
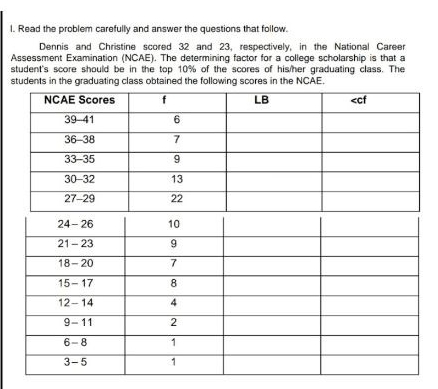

Transcribed Image Text:1. Read the problem carefully and answer the questions that follow.
Dennis and Christine scored 32 and 23, respectively, in the National Career
Assessment Examination (NCAE). The determining factor for a college scholarship is that a
student's score should be in the top 10% of the scores of his/her graduating class. The
students in the graduating class obtained the following scores in the NCAE.
NCAE Scores
LB
<cf
39-41
6.
36-38
7
33-35
30-32
13
27-29
22
24- 26
10
21- 23
18-20
15- 17
8
12-14
4
9- 11
2
6-8
1
3-5
1
Expert Solution
This question has been solved!
Explore an expertly crafted, step-by-step solution for a thorough understanding of key concepts.

This is a popular solution

Trending nowThis is a popular solution!

Step by stepSolved in 3 steps with 3 images

Knowledge Booster

Similar questions
- = The data show the distance (in miles) from an airport of a sample of 22 inbound and outbound airplanes. Use technology to answer parts (a) and (b). a. Find the data set's first, second, and third quartiles. b. Draw a box-and-whisker plot that represents the data set. D 3.2 2.6 3.3 5.9 5.4 3.5 2.6 2.2 5.7 2.9 2.8 2.7 4.3 2.1 1.9 4.6 2.6 5.4 3.6 2.4 5.5 2.2 a. Find the three quartiles. Q₁ Q₂ d (Type integers or decimals. Do not round.) b. Choose the correct box-and-whisker plot below.arrow_forwardB. Directions: For each of the following, calculate the mean, median and mode. Show your solution. (Ungrouped data) 1. 7, 8, 9, 5, 8, 7, 7, 9, 8, 6 2. 100, 120, 132, 122, 145, 121, 105, 109, 3. 115, 119, 114, 112, 112, 109, 104, 106arrow_forwardA student was interested in the cigarette-smoking habits of college students and collected data from an unbiased random sample of students. The data are summarized in the following table. Males who smoke Males who do not smoke Females who smoke Females who do not smoke What type of chart best represents the relative class frequencies? Multiple Choice Pie chart Box plot Frequency polygon 10 40 15 60 Scatterplotarrow_forward
- ??arrow_forwardThe following stem-and-leaf plot represents scores on a university psychology test. If one more person was to take the test, which value would most likely represent the person's expected score? Stem Leaf 5 07 169 7 001258 8 359 24 O 57 O 66 O 70 O 85arrow_forwardGiven the data set: 6, 19, 17, 23, 20, 10. Determine (i). the percentile rank for each test score,arrow_forward
- The scores and the percents of the final grade for a student in a stats class are given. What is the student's mean score? Complete the thirds columnarrow_forwardSuppose you send a survey to 500 people and get 233 responses. You then find that 86% of the responses prefer Coke instead of Pepsi Is the above 86% a parameter or statistic? a. parameter b. statisticarrow_forwardI need help with the questions 2a,2b and 2c. Describe the shape of the distribution of the data. Which movie has the largest budget With all the data obtained, which genre movie tend to have larger budgets.arrow_forward
arrow_back_ios
SEE MORE QUESTIONS
arrow_forward_ios
Recommended textbooks for you
- MATLAB: An Introduction with ApplicationsStatisticsISBN:9781119256830Author:Amos GilatPublisher:John Wiley & Sons Inc
 Probability and Statistics for Engineering and th...StatisticsISBN:9781305251809Author:Jay L. DevorePublisher:Cengage Learning
 Statistics for The Behavioral Sciences (MindTap C...StatisticsISBN:9781305504912Author:Frederick J Gravetter, Larry B. WallnauPublisher:Cengage Learning
  Elementary Statistics: Picturing the World (7th E...StatisticsISBN:9780134683416Author:Ron Larson, Betsy FarberPublisher:PEARSON
 The Basic Practice of StatisticsStatisticsISBN:9781319042578Author:David S. Moore, William I. Notz, Michael A. FlignerPublisher:W. H. Freeman
 Introduction to the Practice of StatisticsStatisticsISBN:9781319013387Author:David S. Moore, George P. McCabe, Bruce A. CraigPublisher:W. H. Freeman
MATLAB: An Introduction with Applications
Statistics
ISBN:9781119256830
Author:Amos Gilat
Publisher:John Wiley & Sons Inc
Probability and Statistics for Engineering and th...
Statistics
ISBN:9781305251809
Author:Jay L. Devore
Publisher:Cengage Learning
Statistics for The Behavioral Sciences (MindTap C...
Statistics
ISBN:9781305504912
Author:Frederick J Gravetter, Larry B. Wallnau
Publisher:Cengage Learning
Elementary Statistics: Picturing the World (7th E...
Statistics
ISBN:9780134683416
Author:Ron Larson, Betsy Farber
Publisher:PEARSON
The Basic Practice of Statistics
Statistics
ISBN:9781319042578
Author:David S. Moore, William I. Notz, Michael A. Fligner
Publisher:W. H. Freeman
Introduction to the Practice of Statistics
Statistics
ISBN:9781319013387
Author:David S. Moore, George P. McCabe, Bruce A. Craig
Publisher:W. H. Freeman