
MATLAB: An Introduction with Applications
6th Edition
ISBN: 9781119256830
Author: Amos Gilat
Publisher: John Wiley & Sons Inc
expand_more
expand_more
format_list_bulleted
Related questions
Question
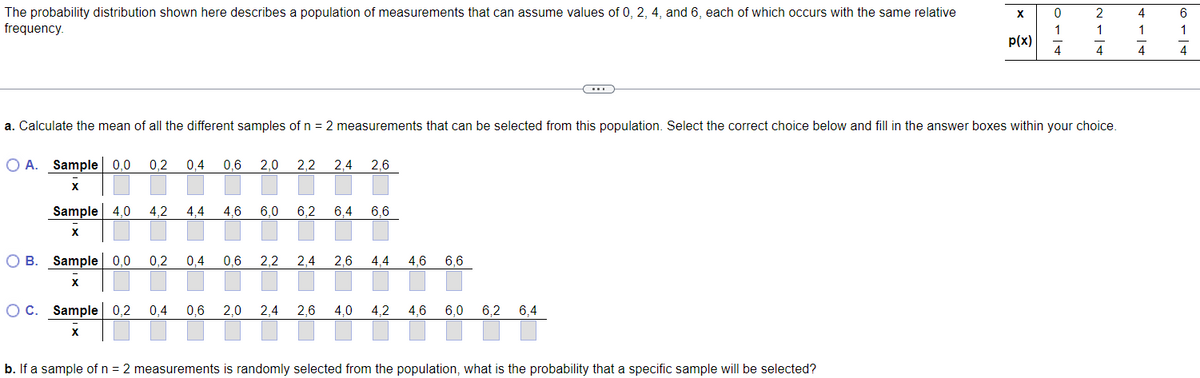

Transcribed Image Text:The probability distribution shown here describes a population of measurements that can assume values of 0, 2, 4, and 6, each of which occurs with the same relative
frequency.
O A. Sample 0,0 0,2 0,4 0,6 2,0 2,2 2,4 2,6
X
Sample 4,0 4,2 4,4 4,6 6,0 6,2 6,4 6,6
X
OB.
B. Sample 0,0 0,2 0,4 0,6 2.2 2,4 2,6 4.4 4,6 6,6
X
a. Calculate the mean of all the different samples of n = 2 measurements that can be selected from this population. Select the correct choice below and fill in the answer boxes within your choice.
O C. Sample 0,2 0,4 0,6 2,0 2,4
X
2,6 4,0 4,2
4,6 6,0 6,2
6,2 6,4
X
b. If a sample of n = 2 measurements is randomly selected from the population, what is the probability that a specific sample will be selected?
p(x)
0
1
4
2
1
4
4
1
4
6
+|+
1
4
Expert Solution
This question has been solved!
Explore an expertly crafted, step-by-step solution for a thorough understanding of key concepts.

This is a popular solution

Trending nowThis is a popular solution!

Step by stepSolved in 4 steps with 2 images

Knowledge Booster

Similar questions
- Consider these sample data: x1=15, x2=9, x3=3, x4=22. a. Find n. b. Compute ∑xi. c.Determine x. a.n=arrow_forwardDetermine H; and o, from the given parameters of the population and sample size. u = 88, o = 18, n= 36arrow_forwardDetermine ; and a from the given parameters of the population and sample size. H= 82, o 21, n= 49 Hi = DDarrow_forward
- The following data represent the miles per gallon for a particular make and model car for six randomly selected vehicles. Compute themean, median, and mode miles per gallon.26.4, 30.2, 24.6, 25.2, 34.5, 36.3 Compute the mean miles per gallon. Select the correct choice below and, if necessary, fill in the answer box to complete your choice.A. The mean mileage per gallon is.(Round to two decimal places as needed.) B. The mean does not exist. Compute the median miles per gallon. Select the correct choice below and, if necessary, fill in the answer box to complete your choice. A. The median mileage per gallon is.(Round to two decimal places as needed.) B. The median does not exist.arrow_forwardDetermine H and a from the given parameters of the population and the sample size. Round the answer to the nearest thousandth where appropriate. H-42, a 36, n=36 a. P b.σ =arrow_forwardFind the weighted estimate, p to test the claim that p, = p2. Use a = 0.05. The sample statistics listed below are from independent samples. n, = 50, x, = 35, and = 60, x, = 40 O A. 0.682 O B. 0.238 C. 1.367 D. 0.328arrow_forward
- Determine Px and ox from the given parameters of the population and sample size. μ = 62, o = 24, n = 35 = ...arrow_forwardFind the population mean or sample mean as indicated. Population: 6, 9, 3, 12, 14, 16 O A. x=11 OB. x= 12 O C. µ= 13 ΟD. μ= 10arrow_forwardConsider these sample data: x, = 12, x2 = 7, X3 = 6, x4 = 22. a. Find n. b. Compute x. c. Determine x.arrow_forward
arrow_back_ios
arrow_forward_ios
Recommended textbooks for you
- MATLAB: An Introduction with ApplicationsStatisticsISBN:9781119256830Author:Amos GilatPublisher:John Wiley & Sons Inc
 Probability and Statistics for Engineering and th...StatisticsISBN:9781305251809Author:Jay L. DevorePublisher:Cengage Learning
 Statistics for The Behavioral Sciences (MindTap C...StatisticsISBN:9781305504912Author:Frederick J Gravetter, Larry B. WallnauPublisher:Cengage Learning
  Elementary Statistics: Picturing the World (7th E...StatisticsISBN:9780134683416Author:Ron Larson, Betsy FarberPublisher:PEARSON
 The Basic Practice of StatisticsStatisticsISBN:9781319042578Author:David S. Moore, William I. Notz, Michael A. FlignerPublisher:W. H. Freeman
 Introduction to the Practice of StatisticsStatisticsISBN:9781319013387Author:David S. Moore, George P. McCabe, Bruce A. CraigPublisher:W. H. Freeman
MATLAB: An Introduction with Applications
Statistics
ISBN:9781119256830
Author:Amos Gilat
Publisher:John Wiley & Sons Inc
Probability and Statistics for Engineering and th...
Statistics
ISBN:9781305251809
Author:Jay L. Devore
Publisher:Cengage Learning
Statistics for The Behavioral Sciences (MindTap C...
Statistics
ISBN:9781305504912
Author:Frederick J Gravetter, Larry B. Wallnau
Publisher:Cengage Learning
Elementary Statistics: Picturing the World (7th E...
Statistics
ISBN:9780134683416
Author:Ron Larson, Betsy Farber
Publisher:PEARSON
The Basic Practice of Statistics
Statistics
ISBN:9781319042578
Author:David S. Moore, William I. Notz, Michael A. Fligner
Publisher:W. H. Freeman
Introduction to the Practice of Statistics
Statistics
ISBN:9781319013387
Author:David S. Moore, George P. McCabe, Bruce A. Craig
Publisher:W. H. Freeman