MATLAB: An Introduction with Applications
6th Edition
ISBN: 9781119256830
Author: Amos Gilat
Publisher: John Wiley & Sons Inc
expand_more
expand_more
format_list_bulleted
Question

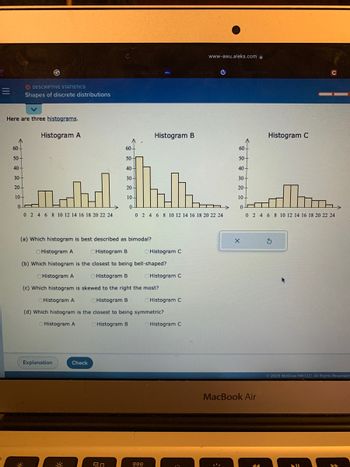
Transcribed Image Text:=
G
O DESCRIPTIVE STATISTICS
Shapes of discrete distributions
Here are three histograms.
Histogram A
60-
50-
40-
30-
20+
10-
Mahd
0-
0 2 4 6 8 10 12 14 16 18 20 22 24
Explanation
Check
Faculty De
en
60-
50-
40-
30-
20-
10-
(a) Which histogram is best described as bimodal?
O Histogram A
OHistogram B
(b) Which histogram is the closest to being bell-shaped?
OHistogram A
Histogram B
(c) Which histogram is skewed to the right the most?
Histogram A
Histogram B
(d) Which histogram is the closest to being symmetric?
Histogram A
Histogram B
Histogram B
000
I...
0 2 4 6 8 10 12 14 16 18 20 22 24
Histogram C
OHistogram C
Histogram C
www-awu.aleks.com
Cilucia Deg
Histogram C
↑
X
60-
50-
40-
30-
20-
10-
0
0 2 4 6 8 10 12 14 16 18 20 22 24
MacBook Air
SICrocse A C
Histogram C
© 2023 McGraw Hill LLC. All Rights Reserved.
7
Expert Solution
This question has been solved!
Explore an expertly crafted, step-by-step solution for a thorough understanding of key concepts.
This is a popular solution
Trending nowThis is a popular solution!
Step by stepSolved in 4 steps

Knowledge Booster
Similar questions
- Tornadoes The following data represent the width (inyards) and length (in miles) of tornadoes.Width (yards), w Length (miles), L200 2.5350 4.8180 2.0300 2.5500 5.8400 4.5500 8.0800 8.0100 3.450 0.5700 9.0600 5.7Source: NOAA(a) Draw a scatter diagram of the data, treating width as theindependent variable.(b) What type of relation appears to exist between the widthand the length of tornadoes?(c) Select two points and find a linear model that containsthe points.(d) Graph the line on the scatter diagram drawn in part (b).(e) Use the linear model to predict the length of a tornadothat has a width of 450 yards.(f) Interpret the slope of the line found in part (c).arrow_forwardStudent Absences and Grades on the Final Exam Dr. V. noticed that the more frequently a student is late or absent from class the worse he or she performs on the final exam. He decided to investigate. Dr. V. collected a random sample of 22 students. This sample includes the number of times a student is absent and their grades on the final exam. The data can be found in the Excel file Assignment10.xlsx. Do not use any software that I did not assign. Question 1: Which or the two variables (times absent or grades on the final exam) is the independent variable and which is the dependent variable? Question 2: Using Microsoft Excel: SHOW YOUR WORK Times Late/Absent Final Exam Grade 1 9 84.00 2 2 92.50 3 12 52.00 4 5 87.00 5 11 75.00 6 24 45.00 7 7 39.00 8 10 46.00 9 19 63.00 10 2 65.00 11 2 98.00 12 17 24.50 13 8 58.00 14 20 69.50 15 55 49.00 16 23 68.50 17 6 70.00 18 4 75.50 19 2 85.00 20 7 97.00 21 2 97.00 22 2 93.50 23 0 93.50 24 2…arrow_forwardhow do you construct a frequency histogram?arrow_forward
- What kind of analysis involves discussing the center of the data in a sample (e.g., the mean or median) and how the data is spread out? A Discrete B Descriptive Inferential D Qualitative E Continuousarrow_forwardWhat is the best description of the shape of the data below? Bell-shaped Skewed right Skewed leftarrow_forwardWhich command can we use to generate a histogram in R? A. histogram() B. histo() C. hist() D. None of the abovearrow_forward
- How are the data search the same? How do they differ? A.) The three data sets have the same mean and mode but have different medians and standard deviations. B.) The three data sets have the same standard deviations but have different means. C.) The three data sets have the same mean, median and mode but have different standard deviations. D.) The three data sets have the same mode but have different standard deviations and means.arrow_forwardHekp me fasttt also whisker and box plotarrow_forward
arrow_back_ios
arrow_forward_ios
Recommended textbooks for you
 MATLAB: An Introduction with ApplicationsStatisticsISBN:9781119256830Author:Amos GilatPublisher:John Wiley & Sons Inc
 Probability and Statistics for Engineering and th...StatisticsISBN:9781305251809Author:Jay L. DevorePublisher:Cengage Learning
 Statistics for The Behavioral Sciences (MindTap C...StatisticsISBN:9781305504912Author:Frederick J Gravetter, Larry B. WallnauPublisher:Cengage Learning
 Elementary Statistics: Picturing the World (7th E...StatisticsISBN:9780134683416Author:Ron Larson, Betsy FarberPublisher:PEARSON
 The Basic Practice of StatisticsStatisticsISBN:9781319042578Author:David S. Moore, William I. Notz, Michael A. FlignerPublisher:W. H. Freeman
 Introduction to the Practice of StatisticsStatisticsISBN:9781319013387Author:David S. Moore, George P. McCabe, Bruce A. CraigPublisher:W. H. Freeman

MATLAB: An Introduction with Applications
Statistics
ISBN:9781119256830
Author:Amos Gilat
Publisher:John Wiley & Sons Inc

Probability and Statistics for Engineering and th...
Statistics
ISBN:9781305251809
Author:Jay L. Devore
Publisher:Cengage Learning

Statistics for The Behavioral Sciences (MindTap C...
Statistics
ISBN:9781305504912
Author:Frederick J Gravetter, Larry B. Wallnau
Publisher:Cengage Learning

Elementary Statistics: Picturing the World (7th E...
Statistics
ISBN:9780134683416
Author:Ron Larson, Betsy Farber
Publisher:PEARSON

The Basic Practice of Statistics
Statistics
ISBN:9781319042578
Author:David S. Moore, William I. Notz, Michael A. Fligner
Publisher:W. H. Freeman

Introduction to the Practice of Statistics
Statistics
ISBN:9781319013387
Author:David S. Moore, George P. McCabe, Bruce A. Craig
Publisher:W. H. Freeman