
MATLAB: An Introduction with Applications
6th Edition
ISBN: 9781119256830
Author: Amos Gilat
Publisher: John Wiley & Sons Inc
expand_more
expand_more
format_list_bulleted
Related questions
Question
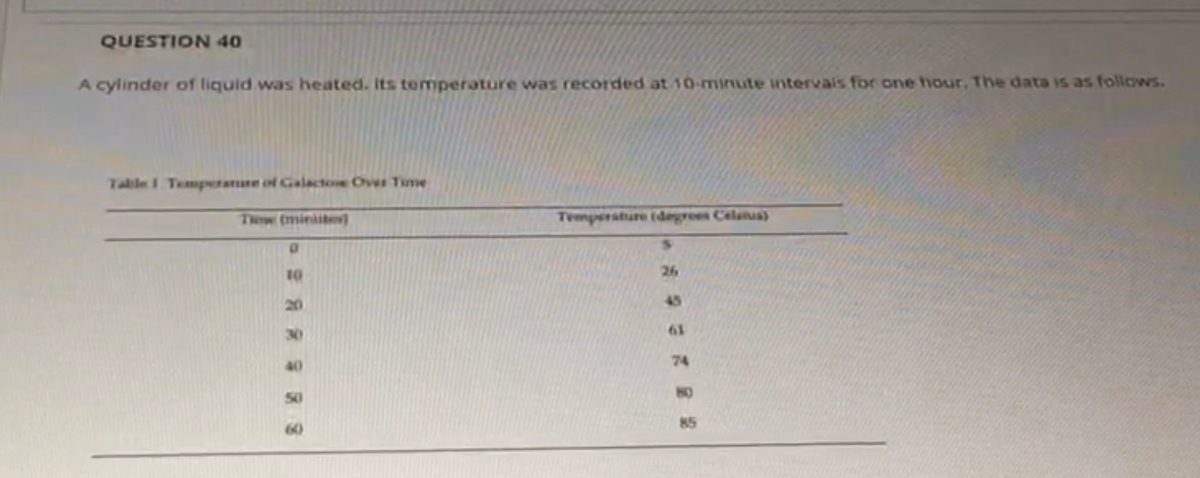

Transcribed Image Text:QUESTION 40
A cylinder of liquid was heated. Its temperature was recorded at 10-minute intervals for one hour. The data is as follows.
Table 1 Temperature of Galactone Over Time
Twe (ministe
D
10
20
30
40
50
60
Temperature (degrees Celsius)
26
45
61
74
BO
85

Transcribed Image Text:a) What type of graph would be used to display the data above?
b) Explain your reasoning.
c) When constructing a graph to display the data above, what information belongs along the y-axis?
d) When constructing a graph to display the data above, what information belongs along the x-axis?
For the toolbar, press ALT+F10 (PC) or ALT+FN+F10 (Mac).
Expert Solution
arrow_forward
Step 1
A cylinder of liquid was heated for 1 hour.
The temperature was recorded for every 10 min interval time.

Step by stepSolved in 3 steps with 1 images

Knowledge Booster

Similar questions
- Give the coordinates of the point in the graph below. a) (3, 0) b) (0, 3) c) (2, 3) d) (0, -5)arrow_forwardMoney in Savings ($) Haruki has $20 in his savings account. He adds $5 each week to the account. He wants to draw a graph that shows how much money is in his savings account over time, starting with $20. 12 8.EE.2.6 omit 40 2oh dont onupo dai 30 25 20 15 3. Time (weeks) What is the equation of the line? A) y = 25x B) y = 20x + 5 C) y = 5x +20 D) y = 5x %3Darrow_forwardDiscrete Matharrow_forward
- he accompanying graphs are dotplots of the number of pairs of shoes owned by men and women who took a survey. Complete parts (a) through (c) below. Males 10 8 0 Pairs of Shoes 70 20 Shape: What is the shape of each dotplot? 100 Females 10 20 30 40 50 60 Pairs of Shoes A. Both dotplots are right-skewed. B. Both dotplots are left-skewed. C. Both dotplots are symmetric or bell-shaped. D. The dotplot for females is right-skewed and the dotplot for males is left-skewed. E. The dotplot for females is left-skewed and the dotplot for males is right-skewed. Center: Is it the males or the females who typically have more pairs of shoes? 90 90 A. Females typically have more pairs of shoes because their mode has a higher frequency than males. B. Males typically have more pairs of shoes because their mode has a higher frequency than females. C. Males typically have more pairs of shoes because they have a larger center value than females. D. Females typically have more pairs of shoes because they…arrow_forwardThe graph above shows data on the prices of used Honda Civic cars. a) What type of graph is this? b) What are the 3 variables represented in this graph? Name each of the 3 variables and state whether each one is categorical or numerical. c) In 2-5 sentences, state 2 main conclusions you take from this graph. Do you think this is a useful graph?arrow_forwardOnly need the last question thank you! Apparently what I already wrote in is incorrect.arrow_forward
- Hi, please solve using typing.arrow_forwardAlpha equals 0.01 level of significance for the given sample data.arrow_forwardA parking garage is located in the downtown area of a city. The table below shows the cost for parking in the garage for different amounts of time. a)What equation represents the cost of parking in the garage, y, for x hours? b)Sketch a graph to represent the cost of parking over time.arrow_forward
arrow_back_ios
SEE MORE QUESTIONS
arrow_forward_ios
Recommended textbooks for you
- MATLAB: An Introduction with ApplicationsStatisticsISBN:9781119256830Author:Amos GilatPublisher:John Wiley & Sons Inc
 Probability and Statistics for Engineering and th...StatisticsISBN:9781305251809Author:Jay L. DevorePublisher:Cengage Learning
 Statistics for The Behavioral Sciences (MindTap C...StatisticsISBN:9781305504912Author:Frederick J Gravetter, Larry B. WallnauPublisher:Cengage Learning
  Elementary Statistics: Picturing the World (7th E...StatisticsISBN:9780134683416Author:Ron Larson, Betsy FarberPublisher:PEARSON
 The Basic Practice of StatisticsStatisticsISBN:9781319042578Author:David S. Moore, William I. Notz, Michael A. FlignerPublisher:W. H. Freeman
 Introduction to the Practice of StatisticsStatisticsISBN:9781319013387Author:David S. Moore, George P. McCabe, Bruce A. CraigPublisher:W. H. Freeman
MATLAB: An Introduction with Applications
Statistics
ISBN:9781119256830
Author:Amos Gilat
Publisher:John Wiley & Sons Inc
Probability and Statistics for Engineering and th...
Statistics
ISBN:9781305251809
Author:Jay L. Devore
Publisher:Cengage Learning
Statistics for The Behavioral Sciences (MindTap C...
Statistics
ISBN:9781305504912
Author:Frederick J Gravetter, Larry B. Wallnau
Publisher:Cengage Learning
Elementary Statistics: Picturing the World (7th E...
Statistics
ISBN:9780134683416
Author:Ron Larson, Betsy Farber
Publisher:PEARSON
The Basic Practice of Statistics
Statistics
ISBN:9781319042578
Author:David S. Moore, William I. Notz, Michael A. Fligner
Publisher:W. H. Freeman
Introduction to the Practice of Statistics
Statistics
ISBN:9781319013387
Author:David S. Moore, George P. McCabe, Bruce A. Craig
Publisher:W. H. Freeman