
MATLAB: An Introduction with Applications
6th Edition
ISBN: 9781119256830
Author: Amos Gilat
Publisher: John Wiley & Sons Inc
expand_more
expand_more
format_list_bulleted
Related questions
Question
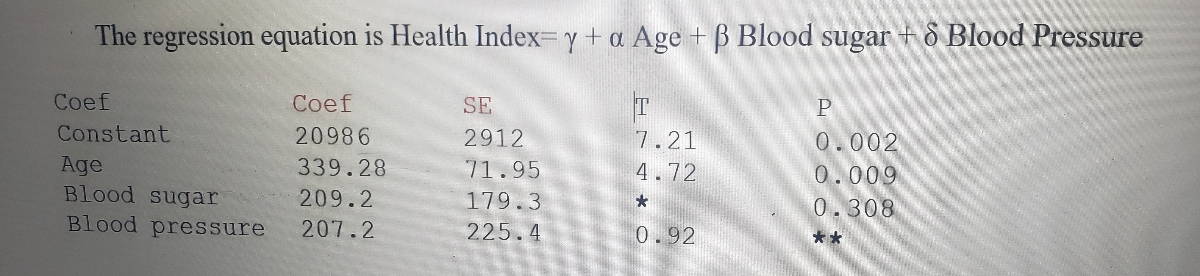

Transcribed Image Text:The regression equation is Health Index= y + a Age + B Blood sugar + 8 Blood Pressure
Coef
20986
339.28
209.2
207.2
Coef
Constant
Age
Blood sugar
Blood pressure
SE
2912
71.95
179.3
225.4
ETO
7.21
4.72
0.92
P
0.002
0.009
0.308
**

Transcribed Image Text:S = 962.233 R-Sq= 86.6% R-Sq (adj) = 76.5%
Analysis of Variance
Source.
DF
Regression
3
Residual Error. 4
Total
7
SS
MS
23863180 7954393
3703570 925892
27566750
F
***
P
0.032
a) What is dependent and independent variables?
b) Fully write out the regression equation.
c) Fill in the missing values **, ***, and *****.
d) Hence test whether & is significant. Give reasons for your answer.
e) Perform the F Test making sure to state the null and alternative hypothesis.
Expert Solution
This question has been solved!
Explore an expertly crafted, step-by-step solution for a thorough understanding of key concepts.

Step by stepSolved in 3 steps

Follow-up Questions
Read through expert solutions to related follow-up questions below.
Follow-up Question
d) Hence test whether ? is significant. Give reasons for your answer. [4]
Solution
by Bartleby Expert
Follow-up Questions
Read through expert solutions to related follow-up questions below.
Follow-up Question
d) Hence test whether ? is significant. Give reasons for your answer. [4]
Solution
by Bartleby Expert
Knowledge Booster

Similar questions
- Explain the Regression Equations if we have two variables X and Y?arrow_forward11) find the equation of the regression line round to 3 significant digits. Productivity 25 23 27 32 45 30 Dexterity 46 40 48 51 56 50arrow_forwardSolve by hand. Do not use any external softwares or programs including Excel.arrow_forward
- Write a multiple regression equation that can be used to analyze the data for a two-factorialdesign with two levels for factor A and three levels for factor B. Define all variables.arrow_forwardWrite short note on regression line?arrow_forwardInterpret the regression coefficient of X3 in relation to the Y ( X3 unit is mile) Y = 58.286 + 13.7604 * X3arrow_forward
- Scenario: A medical researcher wishes to see whether there is a relationship between a person's age, cholesterol level, and systolic blood pressure. Eight people are randomly selected. The data is listed in the table. First, find the multiple regression equation. Next, determine the coefficient of determination. Then, use the regression equation to predict a person's blood pressure reading if the person selected is 50 years old with a cholesterol reading of 220. Age Cholesterol level Blood pressure Person 1 38 220 116 Person 2 41 225 120 Person 3 45 200 123 Person 4 48 190 131 Person 5 51 250 142 Person 6 53 215 145 Person 7 57 200 148 Person 8 61 170 150 Discussion Prompts Respond to the following prompts in your initial post: 1. Identify the explanatory variables and response variable for the data. 2. What is the multiple regression equation for the data? 3. What is the coefficient of determination? 4. If a person 50 years old with a cholesterol of 220 is selected, what is that…arrow_forwardHow will I get output of linear regression formula? Thanks.arrow_forwardA business statistics professor would like to develop a regression model to predict the exam scores for students based on their current GPAs, the number of hours they studied for the exam, and the number of times they were absent during the semester. The data for these variables can be found in this file. a) Run the multiple regression in Excel. Hint: set x1 = GPA, x2 = Hours, X3 = Absences. b) Find the R2 and explain its meaning. c) Explain the outcome of the F test. What does it mean? d) Explain the outcomes of the t tests for the slope coefficients. e) Write out the regression equation. f) Explain the meanings of the slope coefficients.arrow_forward
- What do we mean when we say that a multiple regression model is a multiple linear regression model? What does “linear” mean here? Can we allow any “higher-order terms”? Explain.arrow_forwardWhat are the assumptions of multiple linear regressions only?arrow_forwardJess is running a regression with 3 explanatory variables (also known as independent variables). If she adds another explanatory variable, what must happen? (Check all that apply.) 1-Adjusted R-squared decreases 2-Adjusted R-squared increases 3-The F Stat increases 4-R-squared increasesarrow_forward
arrow_back_ios
SEE MORE QUESTIONS
arrow_forward_ios
Recommended textbooks for you
- MATLAB: An Introduction with ApplicationsStatisticsISBN:9781119256830Author:Amos GilatPublisher:John Wiley & Sons Inc
 Probability and Statistics for Engineering and th...StatisticsISBN:9781305251809Author:Jay L. DevorePublisher:Cengage Learning
 Statistics for The Behavioral Sciences (MindTap C...StatisticsISBN:9781305504912Author:Frederick J Gravetter, Larry B. WallnauPublisher:Cengage Learning
  Elementary Statistics: Picturing the World (7th E...StatisticsISBN:9780134683416Author:Ron Larson, Betsy FarberPublisher:PEARSON
 The Basic Practice of StatisticsStatisticsISBN:9781319042578Author:David S. Moore, William I. Notz, Michael A. FlignerPublisher:W. H. Freeman
 Introduction to the Practice of StatisticsStatisticsISBN:9781319013387Author:David S. Moore, George P. McCabe, Bruce A. CraigPublisher:W. H. Freeman
MATLAB: An Introduction with Applications
Statistics
ISBN:9781119256830
Author:Amos Gilat
Publisher:John Wiley & Sons Inc
Probability and Statistics for Engineering and th...
Statistics
ISBN:9781305251809
Author:Jay L. Devore
Publisher:Cengage Learning
Statistics for The Behavioral Sciences (MindTap C...
Statistics
ISBN:9781305504912
Author:Frederick J Gravetter, Larry B. Wallnau
Publisher:Cengage Learning
Elementary Statistics: Picturing the World (7th E...
Statistics
ISBN:9780134683416
Author:Ron Larson, Betsy Farber
Publisher:PEARSON
The Basic Practice of Statistics
Statistics
ISBN:9781319042578
Author:David S. Moore, William I. Notz, Michael A. Fligner
Publisher:W. H. Freeman
Introduction to the Practice of Statistics
Statistics
ISBN:9781319013387
Author:David S. Moore, George P. McCabe, Bruce A. Craig
Publisher:W. H. Freeman