MATLAB: An Introduction with Applications
6th Edition
ISBN: 9781119256830
Author: Amos Gilat
Publisher: John Wiley & Sons Inc
expand_more
expand_more
format_list_bulleted
Question

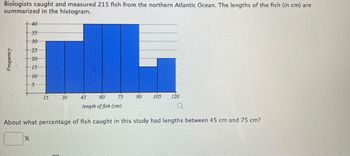
Transcribed Image Text:Biologists caught and measured 215 fish from the northern Atlantic Ocean. The lengths of the fish (in cm) are
summarized in the histogram.
40
35
30
25
20
15
10
5
15
30
45
60
75
90
105 120
length of fish (cm)
About what percentage of fish caught in this study had lengths between 45 cm and 75 cm?
%
Frequency
Expert Solution
This question has been solved!
Explore an expertly crafted, step-by-step solution for a thorough understanding of key concepts.
This is a popular solution
Trending nowThis is a popular solution!
Step by stepSolved in 2 steps with 1 images

Knowledge Booster
Similar questions
- What is the mean of the following data: 0,0, 1, 1, 1, 2, 2, 2, 3, 3arrow_forward101 people were interviewed and were asked about the number of bicycles that they had in their household. The results are shown in the table below: Number of Bicycles Frequency 15 1 30 20 3 15 15 6. What is the median of this set of data? Select one: O a. O b. 4 OC. 3 Od. 2. 45arrow_forwardThe following table represents the survey conducted in a school. Male female Chicken fried steak 26 16 Chicken nugget 17 25 What percent of students like to have chicken nugget?arrow_forward
- Suppose you are testing the null hypothesis that the slope of the regression line is zero versus the alternative hypothesis that the slope is different than zero. Would a very small P-value (i.e., less than 0.0001) indicate a strong relationship between the explanatory variable and the response variable? Yes, because the P-value will give the strength of the association between the explanatory variable and the response variable. Yes, because if the P-value is small, then r2 is large. No, because there could be a lot of scatter about the regression line, indicating a weak relationship between the explanatory variable and the response variable. No, because a large P-value would indicate a strong relationship between the explanatory variable and the response variable.arrow_forwardIn the class poll from the beginning of the year, you were asked what color car you drive. The results are summarized below. aqua 3 beige/tan/gold 39 black 80 blue 44 green 21 orange 3 pink 1 purple 3 red 45 silver 63 white 74 yellow 1 What is the mode for this data set?arrow_forwardWhich statistic would you use if you are interested in comparing the mean number of hours worked by sex.arrow_forward
- What is the median? For sugary drinksarrow_forwardA local store owner is interested in finding the mean age of her customers. She randomly surveys 82 customers and records their age. Identify the population, sample, variable, type of variable, parameter, and statistic.arrow_forwardGiven below are the ages of motorcyclists at the time they were fatally injured in traffic accidents (based on data from the U.S. Department of Transportation). 18 38 23 14 18 34 16 42 28 24 40 20 23 34 37 21 32 25 17 28 33 25 23 19 51 18 29 Looking at the histogram for the data, what is the height (frequency) of the 4th bar on the histogram? Given below are the ages of motorcyclists at the time they were fatally injured in traffic accidents (based on data from the U.S. Department of Transportation). 18 38 23 14 18 34 16 42 28 24 40 20 23 34 37 21 32 25 17 28 33 25 23 19 51 18 29 Looking at the histogram for the data, what is the height (frequency) of the 4th bar on the histogram? 4 7 5 6 8arrow_forward
- A veterinarian recorded how many kittens were born in each litter. This data is summarized in the histogram below. (Note: The last class actually represents "7 or more kittens," not just 7 kittens.) QUESTIONL: What is the frequency of the litter having at most 2 kittens? (PHOTO ATTACHED)arrow_forwardd) Create a 99% Confidence interval for the mean. Provide a sketch of the critical value and calculate the standard error. Only for this part use o = 23.8arrow_forwardI need help with 5 a,b,carrow_forward
arrow_back_ios
SEE MORE QUESTIONS
arrow_forward_ios
Recommended textbooks for you
 MATLAB: An Introduction with ApplicationsStatisticsISBN:9781119256830Author:Amos GilatPublisher:John Wiley & Sons Inc
 Probability and Statistics for Engineering and th...StatisticsISBN:9781305251809Author:Jay L. DevorePublisher:Cengage Learning
 Statistics for The Behavioral Sciences (MindTap C...StatisticsISBN:9781305504912Author:Frederick J Gravetter, Larry B. WallnauPublisher:Cengage Learning
 Elementary Statistics: Picturing the World (7th E...StatisticsISBN:9780134683416Author:Ron Larson, Betsy FarberPublisher:PEARSON
 The Basic Practice of StatisticsStatisticsISBN:9781319042578Author:David S. Moore, William I. Notz, Michael A. FlignerPublisher:W. H. Freeman
 Introduction to the Practice of StatisticsStatisticsISBN:9781319013387Author:David S. Moore, George P. McCabe, Bruce A. CraigPublisher:W. H. Freeman

MATLAB: An Introduction with Applications
Statistics
ISBN:9781119256830
Author:Amos Gilat
Publisher:John Wiley & Sons Inc

Probability and Statistics for Engineering and th...
Statistics
ISBN:9781305251809
Author:Jay L. Devore
Publisher:Cengage Learning

Statistics for The Behavioral Sciences (MindTap C...
Statistics
ISBN:9781305504912
Author:Frederick J Gravetter, Larry B. Wallnau
Publisher:Cengage Learning

Elementary Statistics: Picturing the World (7th E...
Statistics
ISBN:9780134683416
Author:Ron Larson, Betsy Farber
Publisher:PEARSON

The Basic Practice of Statistics
Statistics
ISBN:9781319042578
Author:David S. Moore, William I. Notz, Michael A. Fligner
Publisher:W. H. Freeman

Introduction to the Practice of Statistics
Statistics
ISBN:9781319013387
Author:David S. Moore, George P. McCabe, Bruce A. Craig
Publisher:W. H. Freeman