
MATLAB: An Introduction with Applications
6th Edition
ISBN: 9781119256830
Author: Amos Gilat
Publisher: John Wiley & Sons Inc
expand_more
expand_more
format_list_bulleted
Related questions
Question
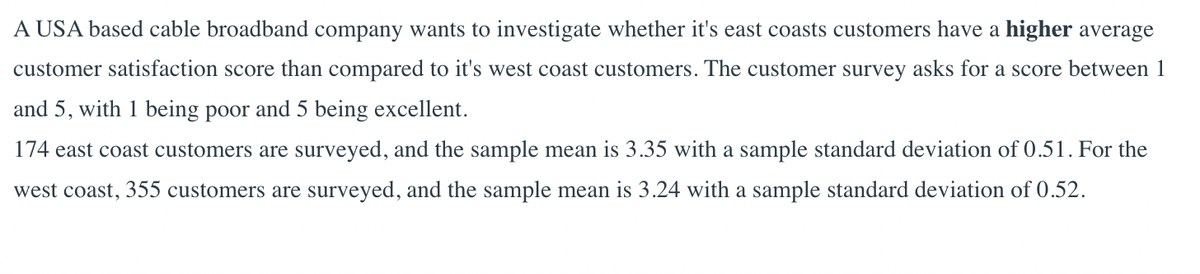

Transcribed Image Text:A USA based cable broadband company wants to investigate whether it's east coasts customers have a higher average
customer satisfaction score than compared to it's west coast customers. The customer survey asks for a score between 1
and 5, with 1 being poor and 5 being excellent.
174 east coast customers are surveyed, and the sample mean is 3.35 with a sample standard deviation of 0.51. For the
west coast, 355 customers are surveyed, and the sample mean is 3.24 with a sample standard deviation of 0.52.

Transcribed Image Text:What is the null and alternative hypothesis for this test?
○ Ho : Xeast - Xwest 0 vs Ha : Xeast - Ăwest ‡ 0
=
Hopeast
O Hopeast
-
:
· µwest ≤ 0 vs Ha μeast
west
=
0 vs Ha east
-
- Hwest > 0
Mwest 0
Expert Solution
This question has been solved!
Explore an expertly crafted, step-by-step solution for a thorough understanding of key concepts.

Step by stepSolved in 4 steps with 1 images

Knowledge Booster

Similar questions
- Choose the correct option and explain.arrow_forwardA luxury furniture manufacture will make custom furniture for their customers. Pricing is based on the number of hours of skilled labor it takes to make a piece. The time it takes to make a custom couch is normally distributed with an average of 280 hours and a standard deviation of 40 hours. What percent of custom couches take 255 hours or less to make? How long would it take to build a couch that is in the 95th percentile?arrow_forwardThe National Coalition on Healthcare suggests that the mean annual premium that a health insurer charges an employer for a health plan covering a family of four averaged $13,000 in 2009. A sample of 30 families of four yields a mean annual premium paid by their employer to be $13,500 with a sample standard deviation of $300. We are interested in whether the mean annual premium that a health insurer charges an employer for a health plan covering a family of four is different from $13,000 using a significance level of 0.10. Select one: a. tdata = 9.129, do not reject Ho. b. tdata = 9.129, reject Ho. c. tdata = -9.129, do not reject Ho. O d. tdata = 4.156, reject Ho.arrow_forward
- Is a measure of 29 inches "far away" from a mean of 19 inches? Suppose the data come from a sample whose standard deviation is 2 inches. A. How many standard deviation is 29 inches from 19 inches? b. Is 29 inches far away from a mean of 19 inches? c. Suppose the standard deviation of the underlying data is 7 inches. Is 29 inches far away from a mean of 19 inches?arrow_forwardAn instructor claims that the average number of hours needed to study for a final exam in order to pass should be 5 hours. A student believes that the instructor is understating the number of hours needed to pass and surveys 36 students and finds the sample mean and standard deviation to be 5.7 and 1.5 hours respectively. Test the instructors claim at a .10 level.arrow_forwardA USA based cable broadband company wants to investigate whether it's east coasts customers have a higher average customer satisfaction score than compared to it's west coast customers. The customer survey asks for a score between 1 and 5, with 1 being poor and 5 being excellent. 174 east coast customers are surveyed, and the sample mean is 3.35 with a sample standard deviation of 0.51. For the west coast, 355 customers are surveyed, and the sample mean is 3.24 with a sample standard deviation of 0.52.arrow_forward
- The providence health maintenance organization wants to establish a criterion for recommending dietary changes if cholesterol levels are in the top 3%. What is the cutoff level for men aged 18 to 24 and the mean is 178.1 and the standard deviation is 40.7arrow_forwardA successful basketball player has a height of 6 feet 11 inches, or 211 cm. Based on statistics from a data set, his height converts to the z score of 5.17. How many standard deviations is his height above the mean?arrow_forwardButt-to-knee length is approximately normally distributed with a mean of 23.1 inches and a standard deviation of 1.2. Theater seats are designed to be comfortable for as many adults as possible. If the seats are required to fit the middle 80% of the population, the seat must be comfortable for what butt-to-knee length range?arrow_forward
arrow_back_ios
arrow_forward_ios
Recommended textbooks for you
- MATLAB: An Introduction with ApplicationsStatisticsISBN:9781119256830Author:Amos GilatPublisher:John Wiley & Sons Inc
 Probability and Statistics for Engineering and th...StatisticsISBN:9781305251809Author:Jay L. DevorePublisher:Cengage Learning
 Statistics for The Behavioral Sciences (MindTap C...StatisticsISBN:9781305504912Author:Frederick J Gravetter, Larry B. WallnauPublisher:Cengage Learning
  Elementary Statistics: Picturing the World (7th E...StatisticsISBN:9780134683416Author:Ron Larson, Betsy FarberPublisher:PEARSON
 The Basic Practice of StatisticsStatisticsISBN:9781319042578Author:David S. Moore, William I. Notz, Michael A. FlignerPublisher:W. H. Freeman
 Introduction to the Practice of StatisticsStatisticsISBN:9781319013387Author:David S. Moore, George P. McCabe, Bruce A. CraigPublisher:W. H. Freeman
MATLAB: An Introduction with Applications
Statistics
ISBN:9781119256830
Author:Amos Gilat
Publisher:John Wiley & Sons Inc
Probability and Statistics for Engineering and th...
Statistics
ISBN:9781305251809
Author:Jay L. Devore
Publisher:Cengage Learning
Statistics for The Behavioral Sciences (MindTap C...
Statistics
ISBN:9781305504912
Author:Frederick J Gravetter, Larry B. Wallnau
Publisher:Cengage Learning
Elementary Statistics: Picturing the World (7th E...
Statistics
ISBN:9780134683416
Author:Ron Larson, Betsy Farber
Publisher:PEARSON
The Basic Practice of Statistics
Statistics
ISBN:9781319042578
Author:David S. Moore, William I. Notz, Michael A. Fligner
Publisher:W. H. Freeman
Introduction to the Practice of Statistics
Statistics
ISBN:9781319013387
Author:David S. Moore, George P. McCabe, Bruce A. Craig
Publisher:W. H. Freeman