
MATLAB: An Introduction with Applications
6th Edition
ISBN: 9781119256830
Author: Amos Gilat
Publisher: John Wiley & Sons Inc
expand_more
expand_more
format_list_bulleted
Related questions
Concept explainers
Topic Video
Question
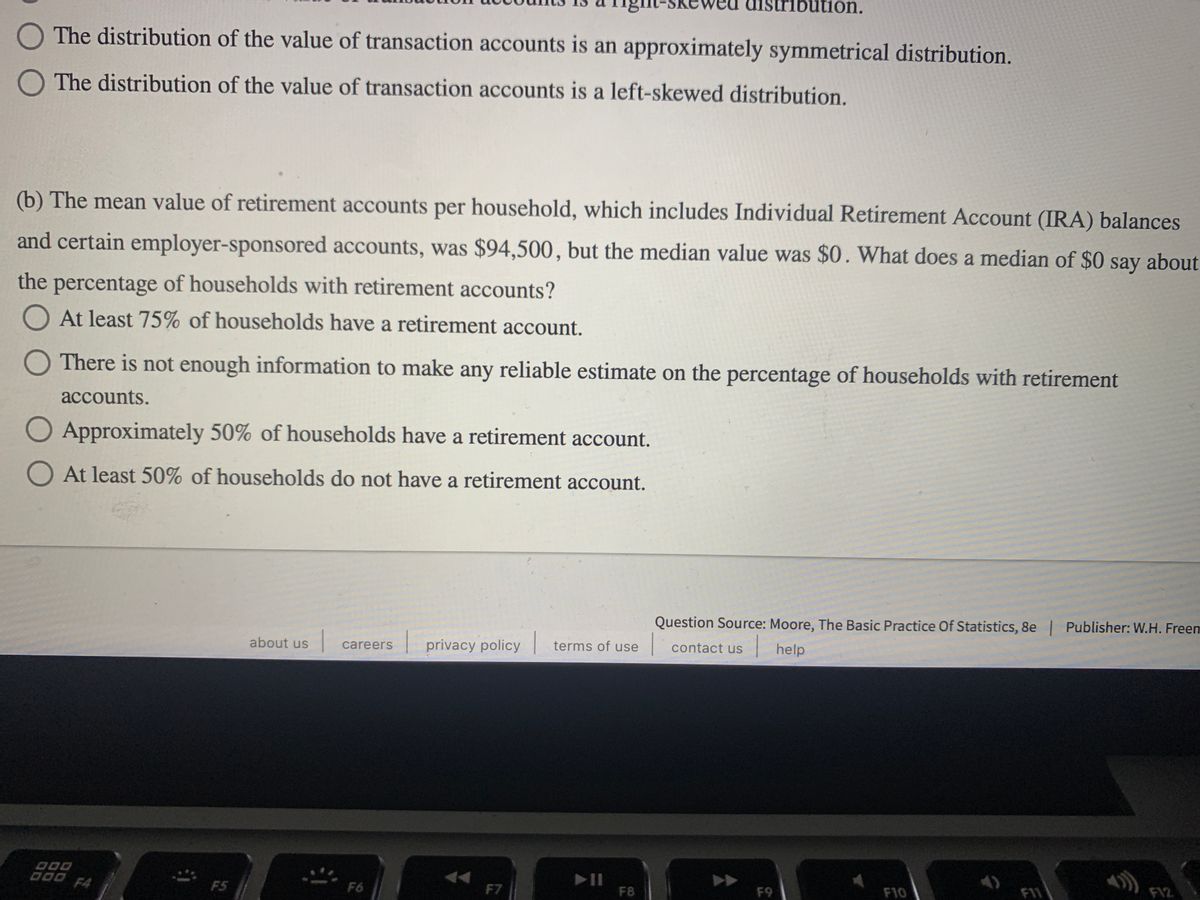

Transcribed Image Text:bution.
The distribution of the value of transaction accounts is an approximately symmetrical distribution.
O The distribution of the value of transaction accounts is a left-skewed distribution.
(b) The mean value of retirement accounts per household, which includes Individual Retirement Account (IRA) balances
and certain employer-sponsored accounts, was $94,500, but the median value was $0. What does a median of $0 say about
the percentage of households with retirement accounts?
O At least 75% of households have a retirement account.
O There is not enough information to make any reliable estimate on the percentage of households with retirement
аccounts.
O Approximately 50% of households have a retirement account.
O At least 50% of households do not have a retirement account.
Question Source: Moore, The Basic Practice Of Statistics, 8e | Publisher: W.H. Freem
| help
about us
privacy policy terms of use
contact us
careers
D00
000 F4
F10
F11
FI2
F5
F6
F7
F8
F9

Transcribed Image Text:Question 9 of 10 >
Once every three years, the Board of Governors of the Federal Reserve System collects data on household assets and
liabilities through the Survey of Consumer Finances (SCF). Some results from the 2013 survey are provided.
(a) Transaction accounts, which include checking, savings, and money market accounts, are the most commonly held type
of financial asset. The mean value of transaction accounts per household was $270,000, and the median value was
$94,500. Which statement explains the differences between the two measures of center?
O The distribution of the value of transaction accounts is a uniform distribution.
O The distribution of the value of transaction accounts is a right-skewed distribution.
O The distribution of the value of transaction accounts is an approximately symmetrical distribution.
O The distribution of the value of transaction accounts is a left-skewed distribution.
(b) The mean value of retirement accounts per household, which includes Individual Retirement Account (IRA) balances
ond oortoin omplover ononcorad o0onta
w 4 500 but the mndion volua wog CO What doog o modion of C0aOU obout
Question Source: Moore, The Basic Practice Of Statistics, 8e | Publisher: W.H. Freemar
about us
privacy policy
terms of use
contact us help
careers
Expert Solution
This question has been solved!
Explore an expertly crafted, step-by-step solution for a thorough understanding of key concepts.

This is a popular solution

Trending nowThis is a popular solution!

Step by stepSolved in 2 steps

Knowledge Booster


Learn more about
Need a deep-dive on the concept behind this application? Look no further. Learn more about this topic, statistics and related others by exploring similar questions and additional content below.Similar questions
- SaveFind the (a) mean, (b) median, (c) mode, and (d) midrange for the data and then (e) answer the given question. Listed below are foot lengths in inches of randomly selected women in a study of a country's military in 1988. Are the statistics representative of the current population of all women in that country's military? 10.5 9.3 9.2 9.3 9.8 8.8 10.3 8.6 8.9 9.2 9.2arrow_forwardFind the (a) mean, (b) median, (c) mode, and (d) midrange for the data and then (e) answer the given questions. Listed below are the highest amounts of net worth (in millions of dollars) of all celebrities. What do the results tell us about the population of all celebrities? Based on the nature of the amounts, what can be inferred about their precision? 275 200 195 180 175 175 170 170 170 170arrow_forwardThe calorie counts for the 17 poultry brands are 129 112 102 106 94 101 97 99 141 113 115 132 86 133 302 146 134 a. Find the mean of the data set. b. Find the Five-number summary of the data set. c. From part (a) and (b), describe the overall distribution of the data set for a non-statistician employer. For example, do you see any kind of skewness in the data set? Is there any outlier? Why?arrow_forward
- State whether the mean, median, mode is being used. a. In 2002,there were as many people aged 25 and younger in the world as there were people age 25 and older. The majority of full time students carry a load of 15 credit hours per semester. The Average annual return on investment is 16.5 percent.arrow_forwardFind the (a) mean, (b) median, (c) mode, and (d) midrange for the data and then (e) answer the given question. Listed below are the amounts (dollars) it costs for marriage proposal packages at different sports venues. Are there any outliers? 49 60 60 184 200 200 a. Find the mean. 60 65 65 85 95 100 105 150 150 175 300 325 375 400 400 400 400 2000 2500 The mean is $ (Type an integer or a decimal rounded to two decimal places as needed.) b. Find the median. The median is $ (Type an integer or a decimal rounded to two decimal places as needed.) c. Find the mode. Select the correct choice below and, if necessary, fill in the answer box to complete your choice. A. The mode(s) is(are) $ (Type an integer or a decimal. Do not round. Use a comma to separate answers as needed.) B. There is no mode. d. Find the midrange. The midrange is $ (Type an integer or a decimal rounded to two decimal places as needed.) e. Are there any outliers? Choose the correct answer below. A. There do not appear to be…arrow_forwardwhich is the correct answer?arrow_forward
- An auto dealer’s sales numbers are shown in the table below. Find the mean price for the cars sold in June. Number sold Price June July August $25,000 21 23 24 $20,000 35 32 37 $15,000 47 51 44arrow_forwardThe following table displays the ages of female actors when they starred in their award-winning performances. Ages of Female Award Recipients 40 41 35 33 29 27 30 34 29 74 35 28 32 45 61 49 49 32 37 39 33 60 33 45 21 27 67 42 26 26 25 34 45 81 36 54 Find the mean and the median for the data in the table. (Round your mean to one decimal place.) mean medianarrow_forwardFind the (a) mean, (b) median, (c) mode, and (d) midrange for the data and then (e) answer the given question. Listed below are the amounts (dollars) it costs for marriage proposal packages at different sports venues. Are there any outliers? 49 50 50 50 55 55 75 85 90 115 150 150 225 234 275 275 300 325 400 475 475 475 475 1500 2500 a. Find the mean. The mean is $ (Type an integer or a decimal rounded to two decimal places as needed.) b. Find the median. The median is $. (Type an integer or a decimal rounded to two decimal places as needed.) c. Find the mode. Select the correct choice below and, if necessary, fill in the answer box to complete your choice. O A. The mode(s) is(are) $ (Type an integer or a decimal. Do not round. Use a comma to separate answers as needed.) OB. There is no mode.arrow_forward
- A survey of 30 people was conducted about how many siblings they had. A graph was created that showed the percentage of the survey group, which had each number of siblings. The "frequency" column in the table shows the number of responses that having a certain number of siblings received. Using appropriate and precise statistical terminology, describe the distribution and provide an explanation for the distribution being a certain way.arrow_forwardIn a data set of wages of productivity lost during a recent recession, the distribution can be roughly described as unimodal and very left-skewed. Select the most appropriate conclusion from the list of statements. A. Calculating the midrange is much more tedious process than calculating the mean. B. The median of wages lost must be far lower than the mean of wages lost. C. The mean is the most representative measure of center for this data set. D. If there are extremely high lost wages present, the mean will not be sensitive to these data values.arrow_forward
arrow_back_ios
arrow_forward_ios
Recommended textbooks for you
- MATLAB: An Introduction with ApplicationsStatisticsISBN:9781119256830Author:Amos GilatPublisher:John Wiley & Sons Inc
 Probability and Statistics for Engineering and th...StatisticsISBN:9781305251809Author:Jay L. DevorePublisher:Cengage Learning
 Statistics for The Behavioral Sciences (MindTap C...StatisticsISBN:9781305504912Author:Frederick J Gravetter, Larry B. WallnauPublisher:Cengage Learning
  Elementary Statistics: Picturing the World (7th E...StatisticsISBN:9780134683416Author:Ron Larson, Betsy FarberPublisher:PEARSON
 The Basic Practice of StatisticsStatisticsISBN:9781319042578Author:David S. Moore, William I. Notz, Michael A. FlignerPublisher:W. H. Freeman
 Introduction to the Practice of StatisticsStatisticsISBN:9781319013387Author:David S. Moore, George P. McCabe, Bruce A. CraigPublisher:W. H. Freeman
MATLAB: An Introduction with Applications
Statistics
ISBN:9781119256830
Author:Amos Gilat
Publisher:John Wiley & Sons Inc
Probability and Statistics for Engineering and th...
Statistics
ISBN:9781305251809
Author:Jay L. Devore
Publisher:Cengage Learning
Statistics for The Behavioral Sciences (MindTap C...
Statistics
ISBN:9781305504912
Author:Frederick J Gravetter, Larry B. Wallnau
Publisher:Cengage Learning
Elementary Statistics: Picturing the World (7th E...
Statistics
ISBN:9780134683416
Author:Ron Larson, Betsy Farber
Publisher:PEARSON
The Basic Practice of Statistics
Statistics
ISBN:9781319042578
Author:David S. Moore, William I. Notz, Michael A. Fligner
Publisher:W. H. Freeman
Introduction to the Practice of Statistics
Statistics
ISBN:9781319013387
Author:David S. Moore, George P. McCabe, Bruce A. Craig
Publisher:W. H. Freeman