
MATLAB: An Introduction with Applications
6th Edition
ISBN: 9781119256830
Author: Amos Gilat
Publisher: John Wiley & Sons Inc
expand_more
expand_more
format_list_bulleted
Related questions
Question
thumb_up100%
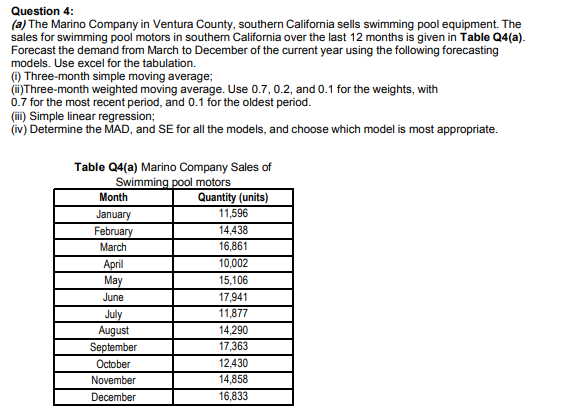

Transcribed Image Text:(a) The Marino Company in Ventura County, southern California sells swimming pool equipment. The
sales for swimming pool motors in southern California over the last 12 months is given in Table Q4(a).
Forecast the demand from March to December of the current year using the following forecasting
models. Use excel for the tabulation.
(1) Three-month simple moving average;
(i)Three-month weighted moving average. Use 0.7, 0.2, and 0.1 for the weights, with
0.7 for the most recent period, and 0.1 for the oldest period.
(ii) Simple linear regression;
(iv) Determine the MAD, and SE for all the models, and choose which model is most appropriate.
Table Q4(a) Marino Company Sales of
Swimming pool motors
Quantity (units)
11,596
Month
January
February
March
14,438
16,861
10,002
April
May
15,106
June
17,941
July
August
September
October
11,877
14,290
17,363
12,430
14,858
November
December
16,833
Expert Solution
This question has been solved!
Explore an expertly crafted, step-by-step solution for a thorough understanding of key concepts.

Step by stepSolved in 3 steps with 5 images

Knowledge Booster


Learn more about
Need a deep-dive on the concept behind this application? Look no further. Learn more about this topic, statistics and related others by exploring similar questions and additional content below.Similar questions
- You collect data of average annual returns for Amazon Stock and Microsoft Stock and make the following table: (This data can be copied into Excel.) Year Amazon Return Microsoft Return 2013 0.5896 0.1221 2014 -0.2218 0.2416 2015 1.1778 0.1944 2016 0.1095 0.1200 2017 0.5596 0.3766 2018 0.2843 0.1874 2019 0.3216 0.5526 You use this data to answer the research question: are true population Amazon Returns greater than true population Microsoft Returns?arrow_forwardThe below data represent the advertising expenditure and sales of Liu Liu Ltd from year 2010 to 2019. Table: Advertising Expenditure vs. Sales from 2010 to 2019 Year Advert. Expenditure Sales Growth rate of Ad. Expenditure Growth rate of Sales (x, £000) (y, £000) 2010 19 84 2011 22 108 18% 29% 2012 32 82 46% -24% 2013 42 86 32% 6% 2014 47 84 11% -3% 2015 46 94 -2% 11% 2016 58 103 27% 10% 2017 63 115 8% 12% 2018 70 106 11% -8% 2019 80 142 15% 34% Total 479 1004 a. What is the statistical relationship shown in the table and list out 3 characteristics of this relationship?arrow_forwardthe table shows the percent of households with internet access for selected years from 2009 and projected through 2015. Year Percent of households 2009 67 2010 70 2011 72.5 2012 75 2013 76.5 2014 77.2 2015 78 Use the model to predict the percent of households with internet access in 2022.arrow_forward
- Month Actual demand Forecasted Demand 1 950 1000 2 1070 1000 3 1100 1000 4 960 1000 5 1090 1000 6 1050 1000 For the dataset above, compute the overall MAPE.arrow_forwardEloise needs to finish a 516-page report on international trade so she can present it at the big conference this weekend. She's been tracking her page count at the end of each business day to see if she's on track. Use Excel to fit a trendline to Eloise's data to create a model of her productivity. According to your model, will Eloise be able to finish her report by the end of the day next Friday? Assume she works only on weekdays. Day Pages Monday 425 Tuesday 431 Wednesday 449 Thursday 464 Friday 471 A: Use Excel to fit a trendline to Eloise's data. What are the slope and intercept for this line? The slope is The intercept is B: Use your model (trendline) to answer the question. Will Eloise finish her report by the end of next friday? Yesarrow_forwardBelow is a table containing data on product demand for the most recent three months along with the forecasts that had been made for those three previous months. Calculate the MAPE. Month Demand Forecast 1 308 310 388 390 344 342 2.arrow_forward
arrow_back_ios
arrow_forward_ios
Recommended textbooks for you
- MATLAB: An Introduction with ApplicationsStatisticsISBN:9781119256830Author:Amos GilatPublisher:John Wiley & Sons Inc
 Probability and Statistics for Engineering and th...StatisticsISBN:9781305251809Author:Jay L. DevorePublisher:Cengage Learning
 Statistics for The Behavioral Sciences (MindTap C...StatisticsISBN:9781305504912Author:Frederick J Gravetter, Larry B. WallnauPublisher:Cengage Learning
  Elementary Statistics: Picturing the World (7th E...StatisticsISBN:9780134683416Author:Ron Larson, Betsy FarberPublisher:PEARSON
 The Basic Practice of StatisticsStatisticsISBN:9781319042578Author:David S. Moore, William I. Notz, Michael A. FlignerPublisher:W. H. Freeman
 Introduction to the Practice of StatisticsStatisticsISBN:9781319013387Author:David S. Moore, George P. McCabe, Bruce A. CraigPublisher:W. H. Freeman
MATLAB: An Introduction with Applications
Statistics
ISBN:9781119256830
Author:Amos Gilat
Publisher:John Wiley & Sons Inc
Probability and Statistics for Engineering and th...
Statistics
ISBN:9781305251809
Author:Jay L. Devore
Publisher:Cengage Learning
Statistics for The Behavioral Sciences (MindTap C...
Statistics
ISBN:9781305504912
Author:Frederick J Gravetter, Larry B. Wallnau
Publisher:Cengage Learning
Elementary Statistics: Picturing the World (7th E...
Statistics
ISBN:9780134683416
Author:Ron Larson, Betsy Farber
Publisher:PEARSON
The Basic Practice of Statistics
Statistics
ISBN:9781319042578
Author:David S. Moore, William I. Notz, Michael A. Fligner
Publisher:W. H. Freeman
Introduction to the Practice of Statistics
Statistics
ISBN:9781319013387
Author:David S. Moore, George P. McCabe, Bruce A. Craig
Publisher:W. H. Freeman