MATLAB: An Introduction with Applications
6th Edition
ISBN: 9781119256830
Author: Amos Gilat
Publisher: John Wiley & Sons Inc
expand_more
expand_more
format_list_bulleted
Concept explainers
Question

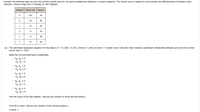
Transcribed Image Text:Consider the following data on price ($) and the overall score for six stereo headphones tested by a certain magazine. The overall score is based on sound quality and effectiveness of ambient noise
reduction. Scores range from 0 (lowest) to 100 (highest).
Brand
Price ($)
Score
A
180
76
В
150
69
C
95
63
70
54
E
70
38
F
35
24
(a) The estimated regression equation for this data is ŷ
21.258 + 0.327x, where x =
price ($) and y
= overall score. Does the t test indicate a significant relationship between price and the overall
score? Use a = 0.05.
State the null and alternative hypotheses.
Ho: B1 + 0
Ha: B1
Ho: B1
Ha: B1 + 0
= 0
O Ho: Po = 0
Ha: Bo + 0
O Ho: B1 2 0
Ha: B1 < 0
O Ho: Po + 0
Hai B
= 0
Find the value of the test statistic. (Round your answer to three decimal places.)
Find the p-value. (Round your answer to four decimal places.)
p-value

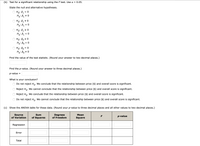
Transcribed Image Text:(b) Test for a significant relationship using the F test. Use a = 0.05.
State the null and alternative hypotheses.
Ho: Bq = 0
Ha: B1 + 0
Ho: B, + 0
1
Ha
B1
Ho: B, 2 0
H3: B1 < 0
Ho: Bo + 0
Ha: Po = 0
Ho: Po
H: Bo + 0
= 0
Find the value of the test statistic. (Round your answer to two decimal places.)
Find the p-value. (Round your answer to three decimal places.)
p-value
What is your conclusion?
Do not reject Ho: We conclude that the relationship between price ($) and overall score is significant.
Reject Ho. We cannot conclude that the relationship between price ($) and overall score is significant.
Reject Ho. We conclude that the relationship between price ($) and overall score is significant.
Do not reject Ho. We cannot conclude that the relationship between price ($) and overall score is significant.
(c) Show the ANOVA table for these data. (Round your p-value to three decimal places and all other values to two decimal places.)
Source
Sum
Degrees
of Freedom
Mean
F
p-value
of Variation
of Squares
Square
Regression
Error
Total
Expert Solution
This question has been solved!
Explore an expertly crafted, step-by-step solution for a thorough understanding of key concepts.
This is a popular solution
Trending nowThis is a popular solution!
Step by stepSolved in 4 steps with 5 images

Knowledge Booster
Learn more about
Need a deep-dive on the concept behind this application? Look no further. Learn more about this topic, statistics and related others by exploring similar questions and additional content below.Similar questions
- Listed below are systolic blood pressure measurements (in mm Hg) obtained from the same woman. Find the regressionequation, letting the right arm blood pressure be the predictor (x) variable. Find the best predicted systolic blood pressure in the left arm given that the systolic blood pressure in the right arm is 90 mm Hg. Use a significance level of 0.05. a. The regression equation is y= (Round to one decimal place as needed.) b. Given that the systolic blood pressure in the right arm is 90 mm Hg, the best predicted systolic blood pressure in the left arm is mm Hg. (Round to one decimal place as needed.)arrow_forwardListed below are systolic blood pressure measurements (in mm Hg) obtained from the same woman. Find the regression equation, letting the right arm blood pressure be the predictor (x) variable. Find the best predicted systolic blood pressure in the left arm given that the systolic blood pressure in the right arm is 85 mm Hg. Use a significance level of 0.05. Right Arm 100 99 92 80 79 O Left Arm 175 169 182 149 148 E Click the icon to view the critical values of the Pearson correlation coefficient r The regression equation is y =+x. (Round to one decimal place as needed.)arrow_forwardThe data show systolic and diastolic blood pressure of certain people. Find the regression equation, letting the systolic reading be the independent (x) variable. If one of these people has a systolic blood pressure of 125 mm Hg, what is the best predicted diastolic blood pressure? Systolic Diastolic Click the icon to view the critical values of the Pearson correlation coefficient r. What is the regression equation? ŷ-+x (Round to two decimal places as needed.) What is the best predicted diastolic blood pressure? y=(Round to one decimal place as needed.) C 148 115 82 83 82 136 115 127 128 140 97 60 65 93 145 101 108arrow_forward
- Listed below are systolic blood pressure measurements (in mm Hg) obtained from the same woman. Find the regressionequation, letting the right arm blood pressure be the predictor (x) variable. Find the best predicted systolic blood pressure in the left arm given that the systolic blood pressure in the right arm is 85 mm Hg. Use a significance level of 0.05. a. The regression equation is y= (Round to one decimal place as needed.) b. Given that the systolic blood pressure in the right arm is 85 mm Hg, the best predicted systolic blood pressure in the left arm is mm Hg. (Round to one decimal place as needed.)arrow_forwardplease view the information listed in the photos and answer the questions in both the photos! thank you :)arrow_forwardUse Excel to find an estimated linear regression equation using X1 and X2 as the independent variables and Y as the dependent. Put your output on a fresh sheet. Then answer the following questions (excel chart in the picture) Write down the estimates regression equation What is the expected value of Y if X1 is 240 and X2 is 290? Show your calculation at a 5%level of significance, are the true coefficients of X1 and X2 different from zero? Justify briefly using numbers from your excel output. 4. Using Excel, determine a 97% confidence interval for the true coefficient of X1arrow_forward
- Use the given data to find the best predicted value of the response variable. Eight pairs of data yield r = 0.742 and the regression equation y = 55.8 + 2.79x. Also, y = 71. 125. What is the best predicted value of y for x = 8.arrow_forwardGiven that the systolic blood pressure in the right arm is 90 mm Hg, the best systolic blood pressure in the left arm is how many mm Hg?arrow_forwardThe American Association of Individual Investors (AAII) On-Line Discount Broker Survey polls members on their experiences with electronic trades handled by discount brokers. As part of the survey, members were asked to rate their satisfaction with the trade price and the speed of execution, as well as provide an overall satisfaction rating. Possible responses (scores) were no opinion (0), unsatisfied (1), somewhat satisfied (2), satisfied (3), and very satisfied (4). For each broker, summary scores were computed by computing a weighted average of the scores provided by each respondent. A portion the survey results follow. Overall Satisfaction with Electronic Trades Brokerage AA BB CC DD FF GG HH II KK LL MM NN Satisfaction with Satisfaction with Trade Price Speed of Execution 3.1 3.1 3.3 3.5 3.2 3.2 3.8 3.7 2.6 2.7 3.9 2.5 3 4 3.2 3.3 3.1 2.8 2.9 2.4 2.7 2.4 2.6 2.3 3.7 2.5 3 1 3.2 3.2 4 3.7 3 2.7 2.7 3.4 2.7 2.3 4 2.5 3 2arrow_forward
- The following estimated regression equation based on 10 observations was presented. ŷ = 28.1270 + 0.6906x, + 0.3980x2 (a) Develop a point estimate of the mean value of y when x, = 170 and x2 = 350. (b) Develop a point estimate for an individual value of y when X1 = 170 and X2 = 350.arrow_forwardIn the following case find the best predicted value of y given the following: x = 2.00, r = -0.567 (p-value = 0.03), y (bar)= 8.00, n = 30 and the equation of the regression line is: y (hat)= 7.00 - 2.00xarrow_forwardI need help finding the answers for A,B,and Carrow_forward
arrow_back_ios
SEE MORE QUESTIONS
arrow_forward_ios
Recommended textbooks for you
 MATLAB: An Introduction with ApplicationsStatisticsISBN:9781119256830Author:Amos GilatPublisher:John Wiley & Sons Inc
 Probability and Statistics for Engineering and th...StatisticsISBN:9781305251809Author:Jay L. DevorePublisher:Cengage Learning
 Statistics for The Behavioral Sciences (MindTap C...StatisticsISBN:9781305504912Author:Frederick J Gravetter, Larry B. WallnauPublisher:Cengage Learning
 Elementary Statistics: Picturing the World (7th E...StatisticsISBN:9780134683416Author:Ron Larson, Betsy FarberPublisher:PEARSON
 The Basic Practice of StatisticsStatisticsISBN:9781319042578Author:David S. Moore, William I. Notz, Michael A. FlignerPublisher:W. H. Freeman
 Introduction to the Practice of StatisticsStatisticsISBN:9781319013387Author:David S. Moore, George P. McCabe, Bruce A. CraigPublisher:W. H. Freeman

MATLAB: An Introduction with Applications
Statistics
ISBN:9781119256830
Author:Amos Gilat
Publisher:John Wiley & Sons Inc

Probability and Statistics for Engineering and th...
Statistics
ISBN:9781305251809
Author:Jay L. Devore
Publisher:Cengage Learning

Statistics for The Behavioral Sciences (MindTap C...
Statistics
ISBN:9781305504912
Author:Frederick J Gravetter, Larry B. Wallnau
Publisher:Cengage Learning

Elementary Statistics: Picturing the World (7th E...
Statistics
ISBN:9780134683416
Author:Ron Larson, Betsy Farber
Publisher:PEARSON

The Basic Practice of Statistics
Statistics
ISBN:9781319042578
Author:David S. Moore, William I. Notz, Michael A. Fligner
Publisher:W. H. Freeman

Introduction to the Practice of Statistics
Statistics
ISBN:9781319013387
Author:David S. Moore, George P. McCabe, Bruce A. Craig
Publisher:W. H. Freeman