
MATLAB: An Introduction with Applications
6th Edition
ISBN: 9781119256830
Author: Amos Gilat
Publisher: John Wiley & Sons Inc
expand_more
expand_more
format_list_bulleted
Related questions
Question
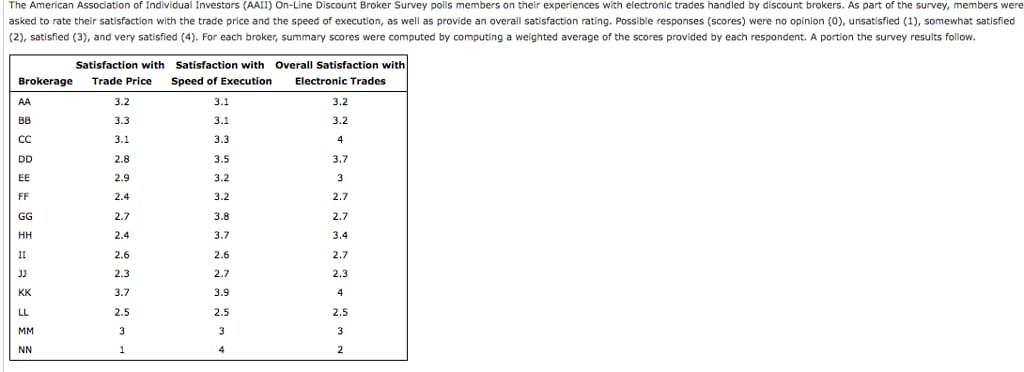

Transcribed Image Text:The American Association of Individual Investors (AAII) On-Line Discount Broker Survey polls members on their experiences with electronic trades handled by discount brokers. As part of the survey, members were
asked to rate their satisfaction with the trade price and the speed of execution, as well as provide an overall satisfaction rating. Possible responses (scores) were no opinion (0), unsatisfied (1), somewhat satisfied
(2), satisfied (3), and very satisfied (4). For each broker, summary scores were computed by computing a weighted average of the scores provided by each respondent. A portion the survey results follow.
Overall Satisfaction with
Electronic Trades
Brokerage
AA
BB
CC
DD
FF
GG
HH
II
KK
LL
MM
NN
Satisfaction with Satisfaction with
Trade Price Speed of Execution
3.1
3.1
3.3
3.5
3.2
3.2
3.8
3.7
2.6
2.7
3.9
2.5
3
4
3.2
3.3
3.1
2.8
2.9
2.4
2.7
2.4
2.6
2.3
3.7
2.5
3
1
3.2
3.2
4
3.7
3
2.7
2.7
3.4
2.7
2.3
4
2.5
3
2

Transcribed Image Text:(b) Use the t test to determine the significance of each independent variable. What are your conclusions at the 0.05 level of significance?
The input in the box below will not be graded, but may be reviewed and considered by your instructor.
blank
(c) Interpret the estimated regression parameters. Are the relationships indicated by these estimates what you would expect?
The input in the box below will not be graded, but may be reviewed and considered by your instructor.
blank
(d) Finger Lakes Investments has developed a new electronic trading system and would like to predict overall customer satisfaction assuming they can provide satisfactory levels of service levels (3) for both trade
price and speed of execution. Use the estimated regression equation developed in part (a) to predict overall satisfaction level for Lakes Investments if they can achieve these performance levels.
If required, round your answer to one decimal places.
(e) What concerns (if any) do you have with regard to the possible responses the respondents could select on the survey?
The input in the box below will not be graded, but may be reviewed and considered by your instructor.
blank
Expert Solution
This question has been solved!
Explore an expertly crafted, step-by-step solution for a thorough understanding of key concepts.

This is a popular solution

Trending nowThis is a popular solution!

Step by stepSolved in 4 steps with 9 images

Knowledge Booster

Similar questions
- An insurance company offers four different deductible levels—none, low, medium, and high—for its homeowner's policyholders and three different levels—low, medium, and high—for its automobile policyholders. The accompanying table gives proportions for the various categories of policyholders who have both types of insurance. For example, the proportion of individuals with both low homeowner's deductible and low auto deductible is 0.07 (7% of all such individuals). Homeowner's Auto N L M H L 0.04 0.07 0.05 0.01 M 0.07 0.11 0.20 0.10 H 0.02 0.03 0.15 0.15 Suppose an individual having both types of policies is randomly selected. (a) What is the probability that the individual has a medium auto deductible and a high homeowner's deductible?(b) What is the probability that the individual has a low auto deductible? A low homeowner's deductible? auto deductible homeowner's deductible (c) What is the probability that the individual is in the same…arrow_forwardThe Wall Street Journal's Shareholder Scoreboard tracks the performance of 1,000 major U.S. companies. The performance of each company is rated based on the annual total return, including stock price changes and the re investment of dividends. Ratings are assigned by dividing all 1,000 companies into five groups from A (top 20%) , B (next 20%), to E (bottom 20%). Shown here are the one- year ratings for a sample of 60 of the largest companies. ABCD 5 8 15 20 12 Do the largest companies differ in performance from the performance of the 1,000 companies in the Shareholder Scoreboard? Use α = 0.05. State the null and alternative hypotheses. Ho: The proportions of the largest companies compared to the 1,000 companies are the same for at least one of the five groups. Ha : The proportions of the largest companies compared to the 1,000 companies are different for all five groups. Ho: The largest companies differ in performance from the 1,000 companies. H₂: : The largest companies do not differ…arrow_forwardOfficial unemployment rates for the U.S. population are reportedon a monthly basis by the Bureau of Labor Statistics.For the period October, 2011, through January, 2012, theofficial unemployment rates were 8.9% (Oct.), 8.7% (Nov.),8.5% (Dec.), and 8.3% (Jan.). (Source: U.S. Bureau of LaborStatistics, www.bls.gov.) If the unemployment rateswere to continue to decrease following a linear model,(a) predict the unemployment rate on January, 2013.(b) predict when the United States would reach a zero unemploymentrate.arrow_forward
- Government economic studies reveal that young adults, not middle-aged or older adults, are having the most difficult time in today’s economy. Although the nation’s labor market shows a decline in the unemployment rate, the percentage of young adults, ages 18 to 24, currently employed (54 percent) is at the lowest level since the government data collection began in 1948. If you were working for a national survey organization doing a general public survey of young adults and older adults, what topics and questions would you design into your survey to elaborate on this finding?arrow_forwardA nutritionist estimates that 57% of her patients stick to the eating plan she helps them design. She also knows that 53% of her patients are diabetic. Additionally she knows that 22.79% of her patients are diabetic and are not sticking to the eating plan she helped them design. (a) What proportion of her patients are not sticking to the eating plan she helped them design? (b) What proportion of her patients are diabetic? (c) Within the nutritionist's patients, being diabetic and not sticking to the eating plan she helped design are which of the following? O dependent O independentarrow_forwardRazor LLC has a data warehouse that is used by several analytics groups. The data warehouse consists of a number of distinct components, including a cloud server (99.999% availability), a database management system server (99.4%), an analytics logic server (94.7%), and, of course, the network infrastructure to the cloud server, which has an availability of 99.9%. What is the overall availability of the system, expressed as a percentage with three digits of precision? For example, enter 91.223, but do not enter a percent symbol, i.e., do not enter 91.223%arrow_forward
arrow_back_ios
arrow_forward_ios
Recommended textbooks for you
- MATLAB: An Introduction with ApplicationsStatisticsISBN:9781119256830Author:Amos GilatPublisher:John Wiley & Sons Inc
 Probability and Statistics for Engineering and th...StatisticsISBN:9781305251809Author:Jay L. DevorePublisher:Cengage Learning
 Statistics for The Behavioral Sciences (MindTap C...StatisticsISBN:9781305504912Author:Frederick J Gravetter, Larry B. WallnauPublisher:Cengage Learning
  Elementary Statistics: Picturing the World (7th E...StatisticsISBN:9780134683416Author:Ron Larson, Betsy FarberPublisher:PEARSON
 The Basic Practice of StatisticsStatisticsISBN:9781319042578Author:David S. Moore, William I. Notz, Michael A. FlignerPublisher:W. H. Freeman
 Introduction to the Practice of StatisticsStatisticsISBN:9781319013387Author:David S. Moore, George P. McCabe, Bruce A. CraigPublisher:W. H. Freeman
MATLAB: An Introduction with Applications
Statistics
ISBN:9781119256830
Author:Amos Gilat
Publisher:John Wiley & Sons Inc
Probability and Statistics for Engineering and th...
Statistics
ISBN:9781305251809
Author:Jay L. Devore
Publisher:Cengage Learning
Statistics for The Behavioral Sciences (MindTap C...
Statistics
ISBN:9781305504912
Author:Frederick J Gravetter, Larry B. Wallnau
Publisher:Cengage Learning
Elementary Statistics: Picturing the World (7th E...
Statistics
ISBN:9780134683416
Author:Ron Larson, Betsy Farber
Publisher:PEARSON
The Basic Practice of Statistics
Statistics
ISBN:9781319042578
Author:David S. Moore, William I. Notz, Michael A. Fligner
Publisher:W. H. Freeman
Introduction to the Practice of Statistics
Statistics
ISBN:9781319013387
Author:David S. Moore, George P. McCabe, Bruce A. Craig
Publisher:W. H. Freeman