
Related questions
Concept explainers
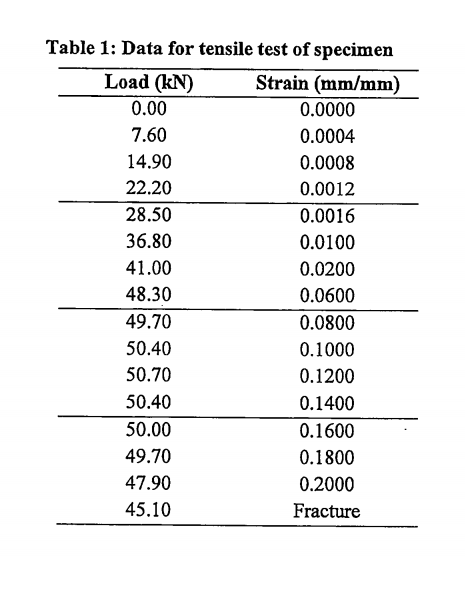
a) A tension test was carried out for a specimen having 610 mm in length and an average diameter of 12.80 mm. The test was conducted until the specimen failed. The data record from a tensile test for the specimen is given in Table 1. A 50 mm gauge length was marked on the specimen before load applied.
Referring to the data in Table 1;
i) Plot a stress-strain diagram by using a scale of 1:0.02 mm/mm for the x-axis and 1:40 MPa for the y-axis. Redraw the elastic region by using a strain scale of 1:0.004 min/mm.
ii) Determine the approximate modulus of elasticity, ultimate stress, and the yield strength of this material at 0.20% offset.
iii) Calculate the modulus of toughness.
iv) Calculate the final length of the specimen, if the specimen elongated about 26.78%.
v) Calculate the percentage of reduction of area and the final diameter at breakage, if the cross-section area decreases to 105.13 mm2


Trending nowThis is a popular solution!

Step by stepSolved in 3 steps with 3 images


- The rectangular plate is deformed into the shape shown by the dashed lines. Suppose that a = 280 mm and b = 420 mm. (Figure 1) Part A Determine the average normal strain along diagonal BD Express your answer using three significant figures. vec Figure (Eavg) BD = mm/mm Submit Request Answer 6 mm 2 mm 2 mm 16 mm Part B D C Determine the average shear strain Yzy at corner B relative to the x, y axes.. Express your answer to three significant figures and include the appropriate units. 2 mm HA B -3 mm (yB)zy = Value Unitsarrow_forwardA tensile test was carried out on a metal specimen. The gauge length of the specimen was 96 mm and the initial (original) cross sectional area was 17.36 mm^2. The final (fractured) length was 107.4 mm and the final cross- sectional area was 16.40mm^2 . Determine the percentage elongation and percentage reduction in area of the specimen.arrow_forwardProblem 1.4. A tensile test was conducted on a mild steel bar. The following data was obtained from the test : (i) Diameter of the steel bar (ii) Gauge length of the bar (iii) Load at elastic limit (iv) Extension at a load of 150 kN. (v) Maximum load (vi) Total extension (vii) Diameter of the rod at the failure Determine : (a) the Young's modulus, = 3 cm = 20 cm = 250 kN = 0.21 mm = 380 kN = 60 mm - 2.25 cm. (c) the percentage elongation, and (b) the stress at lastic limit, (d) the percentage decrease in area.arrow_forward
- 1.5-7 The data shown in the table were obtained from a tensile test of a metal specimen with a rectangular cross section of 0.2 in.² in area and a gage length (the length over which the elongation is measured) of 2.000 inches. a. Generate a table of stress and strain values. b. Plot these values and draw a best-fit line to obtain a stress-strain curve. c. Determine the modulus of elasticity from the slope of the linear portion of the curve. Load (kips) 0 0.5 1.0 1.5 2.0 2.5 3.0 3.5 4.0 4.5 5.0 5.5 50 6.0 6.5 Elongation × 10³ (in.) 0 0.160 0.352 0.706 1.012 1.434 1.712 1.986 2.286 2.612 2.938 3.274 3.632 3.976 Load (kips) 7.0 7.5 8.0 8.5 9.0 9.5 10.0 10.5 11.0 11.5 12.0 12.5 13 Elongation × 10³ (in.) 4.386 4.640 4.988 5.432 5.862 6.362 7.304 8.072 9.044 11.310 14.120 20.044 29.106arrow_forwarda. Calculate the ductility of the sample as a percentage (%) b. Calculate the stress required to create a neck in the sample, in MPa.arrow_forwardCalculation: Compressive Strength (CS) = P/A Where: CS = compressive strength of the specimen, psi (KN/m²) P = maximum load, Ib (KN) A = cross-sectional area of the specimen, inches (m²) Gross Area: Tabulated Data and Result Trial No. b (m) w (m) A (m²) P (kN) CS (kN/m²) 1 0.4 0.15 0.06 150 2 0.4 0.15 0.06 180 3 0.4 0.15 0.06 140 Net Area: Tabulated Data and Result Trial No. A (m²) P (kN) CS (kN/m2) 1 0.0296 150 0.0296 180 0.0296 140arrow_forward
- #3 solution?arrow_forwardCalculate the stress from a 0.3498 in. diameter tensile specimen yielding at 4.407 kips 46.0 ksi 30.6 ksi 33.4 ksi 45.9 ksiarrow_forwardQuestion 3 The strain rosette shown below was used to obtain normal strain data at a point on the free surface of a machine part. Under load, the following strains were measured: Ea = -360 µE, Eb = −230 µɛ, &c = 815 µƐ and v= 0.15 a) Determine the strain components Ex, Ey and Yxy at the point. b) Determine the principal strains and the maximum in-plane shear strain at the point. Figure 1 b 120° 120° 120° a Iarrow_forward
- A compact tension specimen is tested according to ASTM standard E399. The load displacement curve is shown in the Figure below with PQ= 120 kN (Type 1 curve). The specimen dimensions are B=0.5 cm, W=10 cm, and “a” =5 cm. If the materials yield stress is 600 MPa are the conditions correct for a valid K1C measurement? Please look up McEviley’s textbook on the thickness criterion for a valid fracture toughness value.arrow_forwardDrow the shear and bending diagramarrow_forwardProblem 1.4. A tensile test was conducted on a mild steel bar. The following data was obtained from the test : (i) Diameter of the steel bar (ii) Gauge length of the bar (iii) Load at elastic limit (iv) Extension at a load of 150 kN. (v) Maximum load (vi) Total extension (vii) Diameter of the rod at the failure Determine : (a) the Young's modulus, = 3 cm = 20 cm = 250 kN = 0.21 mm = 380 kN = 60 mm - 2.25 cm. (c) the percentage elongation, and (b) the stress at lastic limit, (d) the percentage decrease in area.arrow_forward
 Structural Analysis (10th Edition)Civil EngineeringISBN:9780134610672Author:Russell C. HibbelerPublisher:PEARSON
 Principles of Foundation Engineering (MindTap Cou...Civil EngineeringISBN:9781337705028Author:Braja M. Das, Nagaratnam SivakuganPublisher:Cengage Learning
 Fundamentals of Structural AnalysisCivil EngineeringISBN:9780073398006Author:Kenneth M. Leet Emeritus, Chia-Ming Uang, Joel LanningPublisher:McGraw-Hill Education
 Traffic and Highway EngineeringCivil EngineeringISBN:9781305156241Author:Garber, Nicholas J.Publisher:Cengage Learning