
MATLAB: An Introduction with Applications
6th Edition
ISBN: 9781119256830
Author: Amos Gilat
Publisher: John Wiley & Sons Inc
expand_more
expand_more
format_list_bulleted
Related questions
Topic Video
Question
A t-test would reject the null hypothesis at a 0.05 significance level.
True or False?
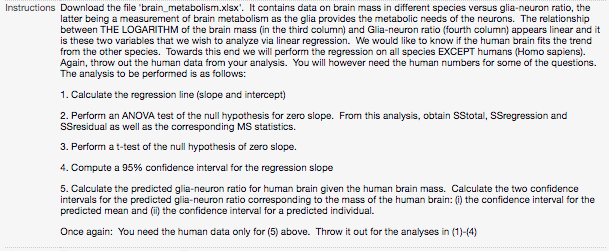

Transcribed Image Text:Instructions Download the file "brain_metabolism.xlsx'. It contains data on brain mass in different species versus glia-neuron ratio, the
latter being a measurement of brain metabolism as the glia provides the metabolic needs of the neurons. The relationship
between THE LOGARITHM of the brain mass (in the third column) and Glia-neuron ratio (fourth column) appears linear and it
is these two variables that we wish to analyze via linear regression. We would like to know if the human brain fits the trend
from the other species. Towards this end we will perform the regression on all species EXCEPT humans (Homo sapiens).
Again, throw out the human data from your analysis. You will however need the human numbers for some of the questions.
The analysis to be performed is as follows:
1. Calculate the regression line (slope and intercept)
2. Perform an ANOVA test of the null hypothesis for zero slope. From this analysis, obtain SStotal, SSregression and
SSresidual as well as the corresponding MS statistics.
3. Perform a t-test of the null hypothesis of zero slope.
4. Compute a 95% confidence interval for the regression slope
5. Calculate the predicted glia-neuron ratio for human brain given the human brain mass. Calculate the two confidence
intervals for the predicted glia-neuron ratio corresponding to the mass of the human brain: (i) the confidence interval for the
predicted mean and (ii) the confidence interval for a predicted individual.
Once again: You need the human data only for (5) above. Throw it out for the analyses in (1)-(4)

Transcribed Image Text:A
В
species
IbrainMass
InBrainMass
gliaNeuronRatio
Homo sapiens
1373.3
7.22
1.65
Pan troglodytes
336.2
5.82
1.2
Gorilla gorilla
509.2
6.23
1.21
Pongo pygmaeus
342.7
5.84
0.98
Hylobates muelleri
101.8
4.62
1.22
Papio anubis
155.8
5.05
0.97
Mandrillus sphinx
159.2
5.07
1.02
Macaca maura
92.6
4.53
0.84
Erythrocebus patas
Cercopithecus kandt
102.3
4.63
1.09
71.6
4.27
1.15
Colobus angolensis
Trachypithecus fran
Alouatta caraya
74.4
4.31
1.2
91.2
4.51
1.14
55.8
4.02
1.12
Saimiri boliviensis
24.1
3.18
0.51
Aotus trivirgatus
13.2
2.58
0.63
Saguinus oedipus
10
2.3
0.46
Leontopithecus rosa
12.2
2.5
0.6
Pithecia pithecia
30
3.4
0.64
Expert Solution
This question has been solved!
Explore an expertly crafted, step-by-step solution for a thorough understanding of key concepts.

This is a popular solution

Trending nowThis is a popular solution!

Step by stepSolved in 2 steps with 2 images

Knowledge Booster


Learn more about
Need a deep-dive on the concept behind this application? Look no further. Learn more about this topic, statistics and related others by exploring similar questions and additional content below.Similar questions
- Suppose a hypothesis test was performed with a level of significance of 0.05. Then if the null hypothesis is actually true, then there is a 5% chance that the researcher will end up rejecting the null hypothesis in error. True Falsearrow_forwardTest the claim that the proportion of people who own a pet is smaller than 50% at the 0.05 significance level. The null and alternative hypothesis would be: Но: р 3 0.5 Но:д > 0.5 Но:д 0.5 Ні:р 0.5 Hi:р + 0.5 The test is: left-tailed two-tailed right-tailed Based on a sample of 600 people, 288 owned a pet, the p-value is: |(to 4 decimals) Based on this we: Fail to reject the null hypothesis Reject the null hypothesisarrow_forwardTest the claim that the proportion of men who own cats is larger than 20% at the .01 significance level. The null and alternative hypothesis would be: Ho: P 0.2 Hop 0.2 Hoμ = 0.2 H₁: p0.2 H₁ : μ 0.2 (to 2 decimals) (to 2 decimals) Ho: p = 0.2 0 H₁: p < 0.2arrow_forward
- Test the claim that the mean GPA of night students is smaller than 2.2 at the 0.025 significance level. The null and alternative hypothesis would be: Ho: 2.2 Ho:p ≤ 0.55 Ho:p≥ 0.55 Ho:p = 0.55 Ho:μ = 2.2 Ho:μ ≤ 2.2 H₁: 0.55 H₁:p 2.2 The test is: two-tailed left-tailed right-tailed Based on a sample of 35 people, the sample mean GPA was 2.15 with a standard deviation of 0.04 The p-value is: Based on this we: O Fail to reject the null hypothesis O Reject the null hypothesis (to 2 decimals)arrow_forwardTest the claim that the mean GPA of night students is larger than 3.1 at the 0.01 significance level. The null and alternative hypothesis would be: Но: р — 0.775 Но:р> 0.775 Но: и — 3.1 Но:р 3.1 Н:р+ 0.775 Hi:р 3.1 H]:p > 0.775 Hi:р < 3.1 The test is: right-tailed two-tailed left-tailed Based on a sample of 80 people, the sample mean GPA was 3.14 with a standard deviation of 0.07 The test statistic is: (to 2 decimals) The p-value is: (to 2 decimals) Based on this we: O Reject the null hypothesis O Fail to reject the null hypothesisarrow_forwardTest the claim that the mean GPA of night students is larger than 2.4 at the 0.025 significance level. The null and alternative hypothesis would be: Ho: µ = — 2.4 Но:р 2.4 Н: + 2.4 H:p> 0.6 H:д> 2.4 Hi:p #0.6 Hi:p < 0.6 Н:р < 2.4 The test is: left-tailed two-tailed right-tailed Based on a sample of 65 people, the sample mean GPA was 2.41 with a standard deviation of 0.03 The test statistic is: (to 2 decimals) The p-value is: (to 2 decimals) Based on this we: O Reject the null hypothesis O Fail to reject the null hypothesisarrow_forward
- When asked what it means for the result of a hypothesis test to be practically significant (or practically important), Tatum says this means that the P-value is small and the null hypothesis has been rejected. what is wrong about this?arrow_forwardImagine that you found that participants in the jelly bean condition had an average acne score o and your significance level was .041. Because your signifinace level is lEss than .05 you reject the null hypothesis. Result #2 imagine that you found that the participants in the jelly bean condition had an average acne score of and your significance level was .00. Because your significance level is less than .05 you reject the null hypothesis. You also note that this result suggest a bigger effect size(30verus10 on your dependant variable). What is the ma in difference between the two scenarios?arrow_forward(e) If the researcher decides to test this hypothesis at the x = 0.05 level of significance, will the researcher reject the null hypothesis? Yes O Noarrow_forward
- Test the claim that the mean GPA of night students is significantly different than 2 at the 0.01 significance level. The null and alternative hypothesis would be: Но: р > 0.5 Нo: 2 H1:p > 0.5 H1:µ # 2 H1:p+ 0.5 H1:µ 2 The test is: right-tailed left-tailed two-tailed Based on a sample of 55 people, the sample mean GPA was 2.05 with a standard deviation of 0.03 The p-value is: (to 2 decimals)arrow_forwardTest the claim that the mean GPA of night students is smaller than 3.3 at the 0.10 significance level. The null and alternative hypothesis would be: Ho:p 0.825 Ho:p ≤ 0.825 Ho: ≤3.3 Ho: 3.3 Ho: 23.3 Ho:p> 0.825 H₁:p0.825 H₁:p> 0.825 H₁:p>3.3 H₁: 3.3 H₁: <3.3 H₁ p < 0.825 O The test is: right-tailed left-tailed two-tailed Based on a sample of 65 people, the sample mean GPA was 3.26 with a standard deviation of 0.02 The test statistic is: (to 2 decimals) The p-value is: Based on this we: O Fail to reject the null hypothesis O Reject the null hypothesis (to 2 decimals)arrow_forward
arrow_back_ios
arrow_forward_ios
Recommended textbooks for you
- MATLAB: An Introduction with ApplicationsStatisticsISBN:9781119256830Author:Amos GilatPublisher:John Wiley & Sons Inc
 Probability and Statistics for Engineering and th...StatisticsISBN:9781305251809Author:Jay L. DevorePublisher:Cengage Learning
 Statistics for The Behavioral Sciences (MindTap C...StatisticsISBN:9781305504912Author:Frederick J Gravetter, Larry B. WallnauPublisher:Cengage Learning
  Elementary Statistics: Picturing the World (7th E...StatisticsISBN:9780134683416Author:Ron Larson, Betsy FarberPublisher:PEARSON
 The Basic Practice of StatisticsStatisticsISBN:9781319042578Author:David S. Moore, William I. Notz, Michael A. FlignerPublisher:W. H. Freeman
 Introduction to the Practice of StatisticsStatisticsISBN:9781319013387Author:David S. Moore, George P. McCabe, Bruce A. CraigPublisher:W. H. Freeman
MATLAB: An Introduction with Applications
Statistics
ISBN:9781119256830
Author:Amos Gilat
Publisher:John Wiley & Sons Inc
Probability and Statistics for Engineering and th...
Statistics
ISBN:9781305251809
Author:Jay L. Devore
Publisher:Cengage Learning
Statistics for The Behavioral Sciences (MindTap C...
Statistics
ISBN:9781305504912
Author:Frederick J Gravetter, Larry B. Wallnau
Publisher:Cengage Learning
Elementary Statistics: Picturing the World (7th E...
Statistics
ISBN:9780134683416
Author:Ron Larson, Betsy Farber
Publisher:PEARSON
The Basic Practice of Statistics
Statistics
ISBN:9781319042578
Author:David S. Moore, William I. Notz, Michael A. Fligner
Publisher:W. H. Freeman
Introduction to the Practice of Statistics
Statistics
ISBN:9781319013387
Author:David S. Moore, George P. McCabe, Bruce A. Craig
Publisher:W. H. Freeman