
A First Course in Probability (10th Edition)
10th Edition
ISBN: 9780134753119
Author: Sheldon Ross
Publisher: PEARSON
expand_more
expand_more
format_list_bulleted
Related questions
Question
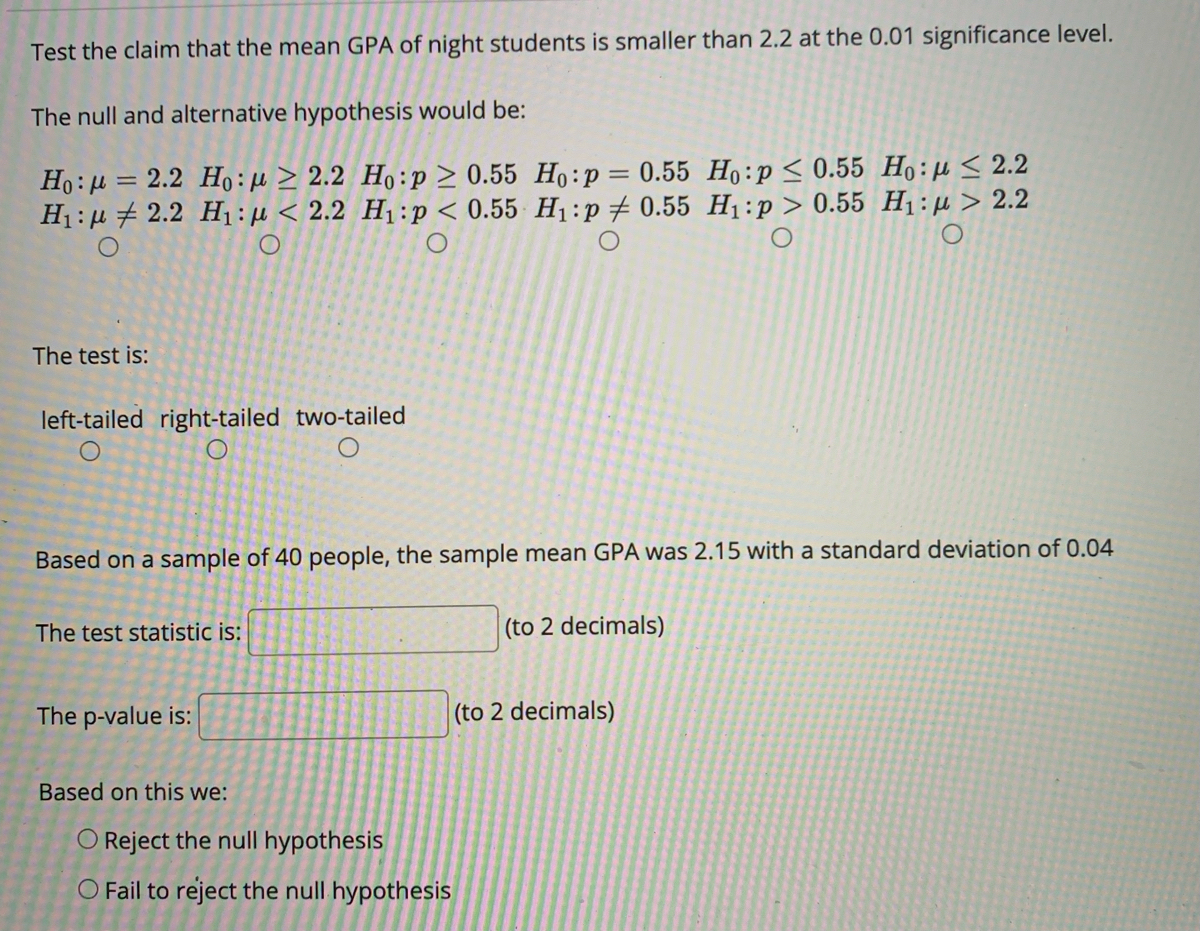

Transcribed Image Text:Test the claim that the mean GPA of night students is smaller than 2.2 at the 0.01 significance level.
The null and alternative hypothesis would be:
Ho: µ = 2.2 Ho:µ > 2.2 Ho:p > 0.55 Ho:p = 0.55 Ho:p<0.55 Ho:µ < 2.2
H1: µ + 2.2 H:H < 2.2 H1:p < 0.55 H1:p 0.55 H1:p> 0.55 H1:µ > 2.2
The test is:
left-tailed right-tailed two-tailed
Based on a sample of 40 people, the sample mean GPA was 2.15 with a standard deviation of 0.04
The test statistic is:
(to 2 decimals)
The p-value is:
(to 2 decimals)
Based on this we:
O Reject the null hypothesis
O Fail to reject the null hypothesis
Expert Solution
This question has been solved!
Explore an expertly crafted, step-by-step solution for a thorough understanding of key concepts.

This is a popular solution

Trending nowThis is a popular solution!

Step by stepSolved in 2 steps with 1 images

Knowledge Booster

Similar questions
- A group of students take a exam and the adverage was m = 90 and the standard deviation was 7.8. Answer the questions using raw scores, z scores and creating a curve. what percentage of the population lands between the raw scores of 86 and 105?arrow_forwardRecords on a fleet of trucks reveal that the average life of a set of spark plugs is normally distributed with a mean of 22,100 miles. The fleet owner purchased 18 sets and found that the sample average life was 23,400 miles; the sample standard deviation was 1,412 miles. To decide if the sample data support the company records that the spark plugs average is LESS THAN 22,100 miles, state your decision in terms of the 6 steps. Use a 0.025 level of significance. 1, define h0 and h1 2. define Alpha 3. which Test, T or Z? 4. decision role, with the picture if necessary. 5. calculate sample test and reach your decision, reject h0 or fail to reject h0 6. conclusion based on the problem.arrow_forwardA large chemistry course took their final exam. The mean was 75 with a standard deviation of 8. What proportion of people scores in the A range (90 or above)?arrow_forward
- Assume that all conditions are met. The mean of the differences was 1.33 and the standard deviation of those differences was 2.90. What is the test statistic for this procedure?arrow_forwardThe frequency distribution was obtained using a class width of 0.5 for data on cigarette tax rates. Use the frequency distribution to approximate the population mean and population standard deviation. Compare these results to the actual mean u= $1.885 and standard deviation o = $1.115. E Click the icon to view the frequency distribution for the tax rates. The population mean is S (Round to three decimal places as needed.)arrow_forwardOn a nationwide math test, the mean was 58 and the standard deviation was 4. If Roberto scored 70, what was his z-score? Use the formula Z where is the mean, o is σ the standard deviation, and x is Roberto's score. Round to 4 decimal places. X н =arrow_forward
- The amount of trash generated by US households (in lbs per day) is normally distributed. You take a sample of 10 people. The sample average is xbar=10.91 lbs, and the sample standard deviation is s=4.736. What is the 99% Conf. Int. for the mean? Group of answer choices a. 6.04 to 15.78 b. 8.33 to 13.49 c. 8.09 to 13.73 d. 7.74 to 14.08arrow_forwardthe golf scores for a school team were normally with a mean of 68 and a standard deviation of 3. Use the Z-table to find the value of k so that 40% of the score are greater than karrow_forwardi need the answer quicklyarrow_forward
- You perform a one-sample t test and calculate a t statistic of 3.0. The mean of your sample was 1.3 and the standard deviation was 2.6. How many participants were used in this study?arrow_forwardforD, E, and F I have the following and want to see if correct:D=0.9579 E=14 F= var(x)=4.2 std deviation= 2.05arrow_forwardYou are given that mean = 50, coefficient of variation = 40% and coeffcient of skewness =-0.4. You are required to find out standard deviation, mode and median.arrow_forward
arrow_back_ios
SEE MORE QUESTIONS
arrow_forward_ios
Recommended textbooks for you
- A First Course in Probability (10th Edition)ProbabilityISBN:9780134753119Author:Sheldon RossPublisher:PEARSON

A First Course in Probability (10th Edition)
Probability
ISBN:9780134753119
Author:Sheldon Ross
Publisher:PEARSON