
MATLAB: An Introduction with Applications
6th Edition
ISBN: 9781119256830
Author: Amos Gilat
Publisher: John Wiley & Sons Inc
expand_more
expand_more
format_list_bulleted
Related questions
Concept explainers
Question
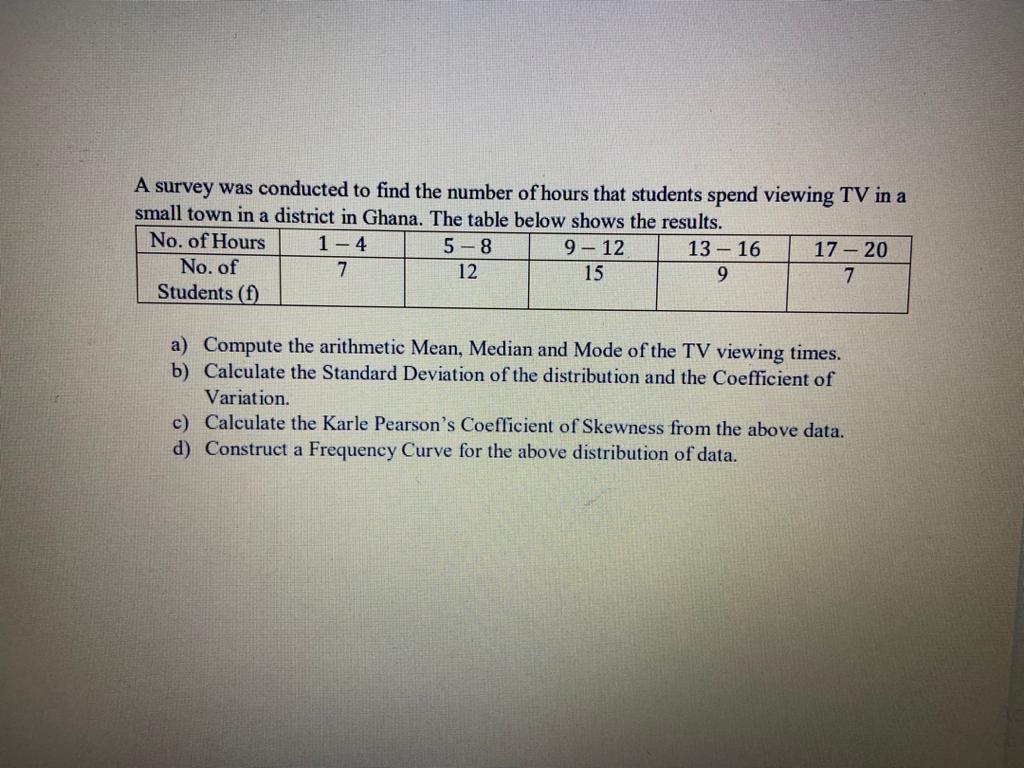

Transcribed Image Text:A survey was conducted to find the number of hours that students spend viewing TV in a
small town in a district in Ghana. The table below shows the results.
No. of Hours
1- 4
5 -8
9 – 12
13 – 16
17 - 20
No. of
7
12
15
9.
Students (f)
a) Compute the arithmetic Mean, Median and Mode of the TV viewing times.
b) Calculate the Standard Deviation of the distribution and the Coefficient of
Variation.
c) Calculate the Karle Pearson's Coefficient of Skewness from the above data.
d) Construct a Frequency Curve for the above distribution of data.
Expert Solution
This question has been solved!
Explore an expertly crafted, step-by-step solution for a thorough understanding of key concepts.

Step by stepSolved in 6 steps with 1 images

Knowledge Booster


Learn more about
Need a deep-dive on the concept behind this application? Look no further. Learn more about this topic, statistics and related others by exploring similar questions and additional content below.Similar questions
- Below is a random sample of measured verbal IQ (IQV) scores from 20 children. 61 82 70 72 72 95 89 57 116 95 82 116 99 74 100 72 126 80 86 94 Include appropriate titles and labels as you complete the following: Construct a stem and leaf plot for the data. Find the mean, median, & mode of the data. Find the range, variance, and standard deviation of the data.arrow_forwardthe table below shows the number of books the Jefferson Middle school students readeach month for nine months. Month Sept. Oct. Nov. Dec. Jan. Feb. Mar. Apr. May Number of Books 293 280 266 280 289 279 275 296 271 If the students read only 101 books for the month of June, which measure of central tendency will have the greatest change?A. The mean will have the greatest change.B. The median will have the greatest change.C. All measures will have an equal change.D. The mode will have the greatest change.arrow_forwardThe average weekly incomes, in £s, of 18 selected occupations in the United Kingdom were: 244, 146, 278, 396, 435, 641, 577, 122, 294 357, 802 730, 286, 484, 169,, 559, 208, 498 Find the median, mode, variance, range, mad, upper extreme, lower extreme. Draw a box plot to represent these incomes. Calculate the mean weekly income and the standard deviation. (HANDWRITTEN OR AT LEAST NOT IN A CODE FORM)arrow_forward
- The ages (in years) of a random sample of shoppers at a gaming store are shown. Determine the range, mean, variance, and standard deviation of the sample data set. 12, 20, 23, 15, 15, 18, 22, 17, 14, 15arrow_forwardThe ages in years of a random sample of shoppers at a gaming store are shown. Determine the range, mean, variance, and standard deviation of the sample data set 12,17,23,14,17,16,20,17,13,15arrow_forwardThe table below summarizes the number of hours a sample of college students spent watching television in the past week. Hours Frequency 10 - 12 4 13 - 15 12 16 - 18 20 19 - 21 14 Find the standard deviation.arrow_forward
arrow_back_ios
arrow_forward_ios
Recommended textbooks for you
- MATLAB: An Introduction with ApplicationsStatisticsISBN:9781119256830Author:Amos GilatPublisher:John Wiley & Sons Inc
 Probability and Statistics for Engineering and th...StatisticsISBN:9781305251809Author:Jay L. DevorePublisher:Cengage Learning
 Statistics for The Behavioral Sciences (MindTap C...StatisticsISBN:9781305504912Author:Frederick J Gravetter, Larry B. WallnauPublisher:Cengage Learning
  Elementary Statistics: Picturing the World (7th E...StatisticsISBN:9780134683416Author:Ron Larson, Betsy FarberPublisher:PEARSON
 The Basic Practice of StatisticsStatisticsISBN:9781319042578Author:David S. Moore, William I. Notz, Michael A. FlignerPublisher:W. H. Freeman
 Introduction to the Practice of StatisticsStatisticsISBN:9781319013387Author:David S. Moore, George P. McCabe, Bruce A. CraigPublisher:W. H. Freeman
MATLAB: An Introduction with Applications
Statistics
ISBN:9781119256830
Author:Amos Gilat
Publisher:John Wiley & Sons Inc
Probability and Statistics for Engineering and th...
Statistics
ISBN:9781305251809
Author:Jay L. Devore
Publisher:Cengage Learning
Statistics for The Behavioral Sciences (MindTap C...
Statistics
ISBN:9781305504912
Author:Frederick J Gravetter, Larry B. Wallnau
Publisher:Cengage Learning
Elementary Statistics: Picturing the World (7th E...
Statistics
ISBN:9780134683416
Author:Ron Larson, Betsy Farber
Publisher:PEARSON
The Basic Practice of Statistics
Statistics
ISBN:9781319042578
Author:David S. Moore, William I. Notz, Michael A. Fligner
Publisher:W. H. Freeman
Introduction to the Practice of Statistics
Statistics
ISBN:9781319013387
Author:David S. Moore, George P. McCabe, Bruce A. Craig
Publisher:W. H. Freeman