
MATLAB: An Introduction with Applications
6th Edition
ISBN: 9781119256830
Author: Amos Gilat
Publisher: John Wiley & Sons Inc
expand_more
expand_more
format_list_bulleted
Related questions
Question
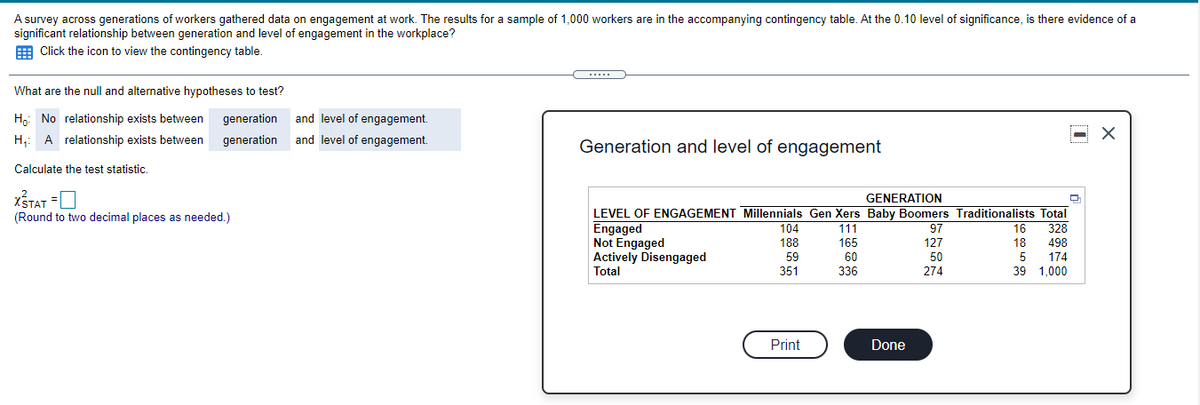

Transcribed Image Text:A survey across generations of workers gathered data on engagement at work. The results for a sample of 1,000 workers are in the accompanying contingency table. At the 0.10 level of significance, is there evidence of a
significant relationship between generation and level of engagement in the workplace?
E Click the icon to view the contingency table.
What are the null and alternative hypotheses to test?
H,: No relationship exists between
generation
and level of engagement.
H,: A relationship exists between
generation
and level of engagement.
Generation and level of engagement
Calculate the test statistic.
XŠTAT =O
GENERATION
LEVEL OF ENGAGEMENT Millennials Gen Xers Baby Boomers Traditionalists Total
Engaged
Not Engaged
Actively Disengaged
Total
(Round to two decimal places as needed.)
104
111
97
16
328
188
165
127
18
498
59
60
50
5
174
351
336
274
39 1,000
Print
Done
Expert Solution
This question has been solved!
Explore an expertly crafted, step-by-step solution for a thorough understanding of key concepts.

This is a popular solution

Trending nowThis is a popular solution!

Step by stepSolved in 3 steps

Knowledge Booster

Similar questions
- One survey showed that among 766 randomly selected subjects who completed four years of college, 18.3% smoke and 81.7% do not smoke. Use a 0.01 significance level to test the claim that the rate of smoking among those with four years of college is less than the 27% rate for the general population. . Calculate the P-value. Which of these options is closest to the P-value? A. 0.0005 B. 0.9999 C. 0.5000 D. 0.0001 e. State the technical conclusion. A. Do not reject Upper H 0 B. Reject Upper H 0 f. State the final conclusion. A. The sample data support the claim. B. There is sufficient evidence to warrant rejection of the claim. C. There is not sufficient evidence to warrant rejection of the claim. D. There is not sufficient sample evidence to support the claim. g. Based on the results, does it appear that those who completed four years of college…arrow_forward211 2 8 4 5 Sample Rooms Inspected Nonconforming Rooms Fraction Nonconforming |004 M2NN286636JEJN=600JOUAWN 10 14 (17||| 24 (100)| 100 100||| 100 100 100 100 100 100 100|| 100 100 100 100 100 MDMDNJO9-JDENOMNOD 13 (ANG) DANGUS D ---- 0.01 0.01 10.03 0.06 0.06 0.06 001 0.05 0.01 0.02 10.05 0.02 0.01 G H H Jarrow_forwardA writing test is given to incoming freshman at a state university before and after they complete a required class on introductory writing. Scores are between 0 and 50 with a higher score indicating that the student has a more positive attitude toward writing. The test scores for a random sample of 15 freshman before and after they completed the introductory writing course are given below. Conduct a hypothesis test to see whether the writing class helped improve the students’ attitudes about writing. Use a significance level of 0.05. Before 35 5 40 18 25 24 46 20 8 22 47 12 24 3 49 After 37 5 37 19 31 28 48 11 11 25 43 16 20 7 48 Hypothesis test neededarrow_forward
- A poll was conducted to investigate opinions about global warming. The respondents who answered yes when asked if there is solid evidence that the earth is getting warmer were then asked to select a cause of global warming. The results are given in the accompanying data table. Use a 0.01 significance level to test the claim that the sex of the respondent is independent of the choice for the cause of global warming. Do men and women appear to agree, or is there a substantial difference? Human activity Natural patterns Don't know 307 Male 139 60 Female 327 158 59 Click here to view the chi-square distribution table. Identify the null and alternative hypotheses. Ho: The sex of the respondent and the choice for the cause of global warming are independent. The sex of the respondent and the choice for the cause of global warming are dependent. Compute the test statistic. (Round to three decimal places as needed.)arrow_forwardRhino viruses typically cause common colds. In a test of the effectiveness of echinacea, 42 of the 47 subjects treated with echinacea developed rhinovirus infections. In a placebo group, 89 of the 102 subjects developed rhinovirus infections. Use a 0.01 significance level to test the claim that echinacea has an effect on rhinovirus infections. Complete parts (a) through (c) below.arrow_forwardWomen athletes at UČLA have a long-term graduation rate of 96%. Over the past several years, a random sample of 40 women athletes at UCLA showed that 37 eventually graduated. Do the data indicate that the population proportion of women athletes who graduate from UCLA is now less than 96%? Use a 5% significance level. You must identify the following in your answer in order to receive credit. Upload your response 1. State Ho and H1 2. Find the test statistic z (Round to two decimal places) 3. Find the p-value (Round to four decimal places) 4. Indicate the calculator key you used. 5. Do you reject Ho or fail to reject Ho? 6. State your conclusion: Upload Choose a File « Previous Nextarrow_forward
- what do part b and part f say? I'm unsure what all the words say.arrow_forwardRhino viruses typically cause common colds. In a test of the effectiveness of echinacea, 42 of the 48 subjects treated with echinacea developed rhinovirus infections. In a placebo group, 93 of the 109 subjects developed rhinovirus infections. Use a 0.01 significance level to test the claim that echinacea has an effect on rhinovirus infections. Complete parts (a) through (c) below.arrow_forwardThe US Department of Energy reported that 49% of homes were heated by natural gas. A random sample of 327 homes in Oregon found that 143 were heated by natural gas. Test the claim that proportion of homes in Oregon that were heated by natural gas is different than what was reported. Use a 10% significance level. Give answer to at least 4 decimal places. a. What are the correct hypotheses? (Select the correct symbols and use decimal values not percentages.) H0: H1: Based on the hypotheses, compute the following:b. Test Statistic = c. p-value = d. Based on the above we choose to e. The correct summary would be: that the proportion of homes in Oregon that were heated by natural gas is different than what the DOE reported value of 49%. Question HelpQuestion 14: Video1arrow_forward
- A study was conducted to determine the proportion of people who dream in black and white instead of color. Among 323 people over the age of 55, 73 dream in black and white, and among 315 people under the age of 25, 18 dream in black and white. Use a 0.01 significance level to test the claim that the proportion of people over 55 who dream in black and white proportion for those under 25. Complete parts (a) through (c) below. greater than the Identify the test statistic. z= 6.10 (Round to two decimal places as needed.) Identify the P-value. @ 2 P-value=0.000 (Round to three decimal places as needed.) What is the conclusion based on the hypothesis test? View an example Get more help. H₁: P₁ P₂ W S The P-value is less than the significance level of a 0.01, so dream in black and white is greater than the proportion for those under 25. reject b. Test the claim by constructing an appropriate confidence interval. The 98% confidence interval is O L command F10 P H₁: Pg #P₂ L ; Clear all I…arrow_forwardThe Bureau of Labor Statistics reports that the official unemployment rate for Black people was 10.4% and 4.7% for White people in February 2015. Select all correct answers for this question. O The samples of white and black people are independent. The explanatory variable is the unemployment rate. The response variable is the unemployment rate. The response variable is race.arrow_forwardChi-sauare distribution table Question Viewer Degrees of Freedom 1 234569 7 8 10 0.995 0.010 0.072 0.207 0.412 0.676 0.989 1.344 1.735 2.156 0.99 0.020 0.115 0.297 0.554 0.872 1.239 1.646 2.088 2.558 Area to the Right of the critical value 0.975 0.001 0.051 0.216 0.484 0.831 1.237 1.690 2.180 2.700 3.247 0.95 0.004 0.103 0.352 0.711 1.145 1.635 2.167 2.733 3.325 3.940 I 0.90 0.016 0.211 0.584 1.064 1.610 2.204 2.833 3.490 4.168 4.865 0.10 2.706 4.605 6.251 7.779 9.236 10.645 12.017 13.362 14.684 15.987arrow_forward
arrow_back_ios
SEE MORE QUESTIONS
arrow_forward_ios
Recommended textbooks for you
- MATLAB: An Introduction with ApplicationsStatisticsISBN:9781119256830Author:Amos GilatPublisher:John Wiley & Sons Inc
 Probability and Statistics for Engineering and th...StatisticsISBN:9781305251809Author:Jay L. DevorePublisher:Cengage Learning
 Statistics for The Behavioral Sciences (MindTap C...StatisticsISBN:9781305504912Author:Frederick J Gravetter, Larry B. WallnauPublisher:Cengage Learning
  Elementary Statistics: Picturing the World (7th E...StatisticsISBN:9780134683416Author:Ron Larson, Betsy FarberPublisher:PEARSON
 The Basic Practice of StatisticsStatisticsISBN:9781319042578Author:David S. Moore, William I. Notz, Michael A. FlignerPublisher:W. H. Freeman
 Introduction to the Practice of StatisticsStatisticsISBN:9781319013387Author:David S. Moore, George P. McCabe, Bruce A. CraigPublisher:W. H. Freeman
MATLAB: An Introduction with Applications
Statistics
ISBN:9781119256830
Author:Amos Gilat
Publisher:John Wiley & Sons Inc
Probability and Statistics for Engineering and th...
Statistics
ISBN:9781305251809
Author:Jay L. Devore
Publisher:Cengage Learning
Statistics for The Behavioral Sciences (MindTap C...
Statistics
ISBN:9781305504912
Author:Frederick J Gravetter, Larry B. Wallnau
Publisher:Cengage Learning
Elementary Statistics: Picturing the World (7th E...
Statistics
ISBN:9780134683416
Author:Ron Larson, Betsy Farber
Publisher:PEARSON
The Basic Practice of Statistics
Statistics
ISBN:9781319042578
Author:David S. Moore, William I. Notz, Michael A. Fligner
Publisher:W. H. Freeman
Introduction to the Practice of Statistics
Statistics
ISBN:9781319013387
Author:David S. Moore, George P. McCabe, Bruce A. Craig
Publisher:W. H. Freeman