
MATLAB: An Introduction with Applications
6th Edition
ISBN: 9781119256830
Author: Amos Gilat
Publisher: John Wiley & Sons Inc
expand_more
expand_more
format_list_bulleted
Related questions
Question
thumb_up100%

Transcribed Image Text:A statistical program is recommended.
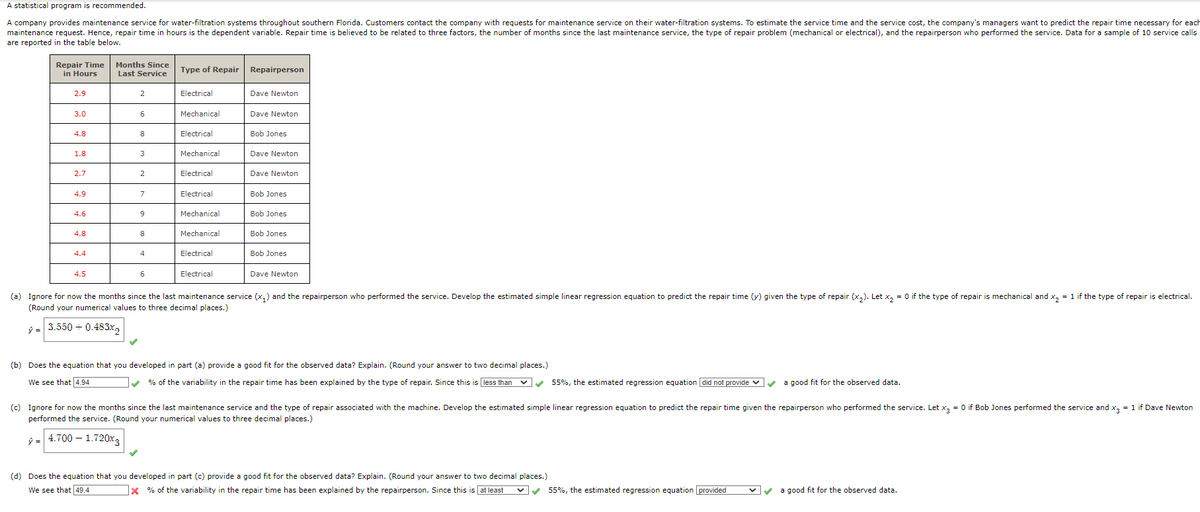
A company provides maintenance service for water-filtration systems throughout southern Florida. Customers contact the company with requests for maintenance service on their water-filtration systems. To estimate the service time and the service cost, the company's managers want to predict the repair time necessary for each
maintenance request. Hence, repair time in hours is the dependent variable. Repair time is believed to be related to three factors, the number of months since the last maintenance service, the type of repair problem (mechanical or electrical), and the repairperson who performed the service. Data for a sample of 10 service calls
are reported in the table below.
Repair Time
in Hours
2.9
3.0
4.8
1.8
2.7
4.9
4.6
4.8
4.4
4.5
Months Since
Last Service
2
6
8
3
2
7
9
8
4
6
Type of Repair Repairperson
Electrical
Mechanical
Electrical
Mechanical
Electrical
Electrical
Mechanical
Mechanical
Electrical
Electrical
Dave Newton
Dave Newton
Bob Jones
Dave Newton
Dave Newton
Bob Jones
Bob Jones
Bob Jones
Bob Jones
Dave Newton
(a) Ignore for now the months since the last maintenance service (x₁) and the repairperson who performed the service. Develop the estimated simple linear regression equation to predict the repair time (y) given the type of repair (x₂). Let x₂ = 0 if the type of repair is mechanical and x₂ = 1 if the type of repair is electrical.
(Round your numerical values to three decimal places.)
y = 3.550 + 0.483x2
(b) Does the equation that you developed in part (a) provide a good fit for the observed data? Explain. (Round your answer to two decimal places.)
We see that 4.94
✔% of the variability in the repair time has been explained by the type of repair. Since this is less than
55%, the estimated regression equation did not provide ✓ ✓ a good fit for the observed data.
(c) Ignore for now the months since the last maintenance service and the type of repair associated with the machine. Develop the estimated simple linear regression equation to predict the repair time given the repairperson who performed the service. Let x3 = 0 if Bob Jones performed the service and x3 = 1 if Dave Newton
performed the service. (Round your numerical values to three decimal places.)
y = 4.700-1.720x3
(d) Does the equation that you developed in part (c) provide a good fit for the observed data? Explain. (Round your answer to two decimal places.)
We see that 49.4
% of the variability in the repair time has been explained by the repairperson. Since this is at least ✓ ✓
55%, the estimated regression equation provided
✓✓
a good fit for the observed data.
Expert Solution
This question has been solved!
Explore an expertly crafted, step-by-step solution for a thorough understanding of key concepts.

This is a popular solution

Trending nowThis is a popular solution!

Step by stepSolved in 2 steps with 5 images

Knowledge Booster

Similar questions
- The data used is from college campuses. The variables used in the analysis below include: crime, total campus crime; enroll, total enrollment; police, employed officers. Use the estimated OLS models to answer the questions below: Model A: In(crime) = -6.631 + 1.270ln(enroll), (1.034) (.110) n = 97; R² = .5804 Model B: In(crime) = -4.794 + .923ln(enroll) (.144) (1.112) n = 97; R² = .632 +.516ln(police), (.149) Using Model A, test the null hypothesis that elasticity of crime with respect to enrollment is unit elastic, i.e. equal to one (against a two-sided alternative). Calculate the t-statistic.arrow_forwardUsing data from the U.S. Census Bureau, we will analyze the relationship between living below the poverty line and access to health care for a selected sample of 14 states. Use the percentage of the population without health insurance as the dependent variable to calculate the intercept and provide an interpretation of the intercept. Do include the value of the intercept in your answer. State % uninsured % below poverty line Arkansas 9.6 16.2 California 8.3 11.8 Florida 16.1 12.7 Indiana 9.7 11.9 Kentucky 6.7 16.3 New Jersey 9.2 8.7 New Mexico 11.5 18.2 New York 6.3 13.0 8.1 10.6 North Dakota 6.7 12.0 Pennsylvania 4.8 10.8 Rhode Island 19.9 13.6 Техas 7.5 9.8 Washington 6.5 10.4 Wisconsin Souce Amencan Community Survey 2019 Your answer W 99+arrow_forwardA standardized exam's scores are normally distributed. In a recent year, the mean test score was 1471 and the standard deviation was 318. The test scores of four students selected at random are 1910, 1210, 2210, and 1370. Find the z-scores that correspond to each value and determine whether any of the values are unusual. The z-score for 1910 is (Round to two decimal places as needed.)arrow_forward
- A Cohort study was planned to identify the relationship between smoking and lung cancer. The number of people in smoker group was 500 people while the number of people in non- smokers group was 1000 people. The number of people with lung cancer was 250 people and 100 people in smokers group and non-smokers group respectively. Fill in the table below: Lung Cancer No disease diagnosed Smokers Non smokers Calculate the relative risk of lung cancer in smokers when compared with non- smokers.arrow_forwardThe key measure of disease occurrence for assessing risk of a disease: Question 13 options: is primarily incidence data. is primarily prevalence data. could equally be both incidence and prevalence data. is neither incidence data nor prevalence data.arrow_forwardUse excel pleasearrow_forward
- As humans we consume food. The body extracts good things such as proteins and vitamins and throws away waste. A typical waste product is uric acid. High levels of uric acid can be an indication of conditions such as gout, kidney disease, and cancer. For females a high level of uric acid is 6 mg/dL or more and for males a high level of uric acid is 7 mg/dL or more. Suppose, over a period of months, an adult male was given 6 blood tests for uric acid. The results of each blood test are shown below. results 9.48 11.1 8.58 11.4 10.34 11.58 The distribution of uric acid in healthy adult males is normally distributed with known population standard deviation, σ=1.94σ=1.94 mg/dl.Find a 95% confidence interval for the population mean of uric acid in this adult male's blood. Assume the sample of blood tests were given in a way that's equivalent to a simple random sample. (Round your answers to two decimal places.)margin of error __ mg/dL lower limit ___ mg/dL upper limit ___ mg/dLarrow_forwardAccording to the CDC, cholesterol levels can be reduced by following a healthy diet, getting regular exercise, and reducing the amount of alcohol consumed on a weekly basis. One method of monitoring overall cholesterol levels is to calculate your cholesterol ratio (LDL/HDL), in general a cholesterol ratio between 3.5 and 5.0 is considered to be healthy for most adults. Suppose you are a clinical researcher testing the effects of these lifestyle changes on patient cholesterol levels. In order to determine if following these guidelines helps to reduce overall cholesterol, a total of 18 participants (N = 18) with moderate to high cholesterol ratios (i.e., 3.91 to > 5.0) were recruited for a healthy lifestyle study and their cholesterol ratio was calculated three times over a six week period: Week 0 (baseline), Week 3, and Week 6. Using the variables "Week 0", "Week 3", and "Week 6" in the data set, conduct a One-Way, Within Subjects (AKA Repeated Measures) ANOVA, at α = 0.05, to see…arrow_forwardAccording to the CDC, cholesterol levels can be reduced by following a healthy diet, getting regular exercise, and reducing the amount of alcohol consumed on a weekly basis. One method of monitoring overall cholesterol levels is to calculate your cholesterol ratio (LDL/HDL), in general a cholesterol ratio between 3.5 and 5.0 is considered to be healthy for most adults. Suppose you are a clinical researcher testing the effects of these lifestyle changes on patient cholesterol levels. In order to determine if following these guidelines helps to reduce overall cholesterol, a total of 18 participants (N = 18) with moderate to high cholesterol ratios (i.e., 3.91 to > 5.0) were recruited for a healthy lifestyle study and their cholesterol ratio was calculated three times over a six week period: Week 0 (baseline), Week 3, and Week 6. Using the variables "Week 0", "Week 3", and "Week 6" in the data set, conduct a One-Way, Within Subjects (AKA Repeated Measures) ANOVA, at α = 0.05, to see…arrow_forward
- Intensive care units (ICUS) generally treat the sickest patients in a hospital. ICUs are often the most expensive department in a hospital because of the specialized equipment and extensive training required to be an ICU doctor or nurse. Therefore, it is important to use ICUs as efficiently as possible in a hospital. According to a 2017 arge-scale study of elderly ICU patients, the average length of stay in the ICU is 3.4 days (Critical Care Medicine journal article). Assume that this length of stay in the ICU has an exponential distribution. Do not round intermediate calculations. What is the probability that the length of stay in the ICU is one day or less (to 4 decimals)? 2857 b. What is the probability that the length of stay in the ICU is between two and three days (to 4 decimals)? What is the probability that the length of stay in the ICU is more than five days (to 4 decimals)? Hide Feedbackarrow_forwardJoan's Nursery specializes in custom-designed landscaping for residential areas. The estimated labor cost associated with a particular landscaping proposal is based on the number of plantings of trees, shrubs, and so on to be used for the project. For cost-estimating purposes, managers use two hours of labor time for the planting of a medium-sized tree. Actual times from a sample of 10 plantings during the past month follow (times in hours). B, C, and Darrow_forward1. Identify whether the variable in the information below is qualitative or quantitative. A nurse collects blood from kids and measure their blood-sugar content. This measure of blood-sugar concentration is a variable. a. quantitative b. qualitative c. qualitative as well as quantitative d. neither qualitative nor quantitative 2. Identify the technique for gathering data in the study below. A pharmaceutical firm wants test the effectiveness of a new drug. It wants to know if the new drug is significantly stronger than the conventional drug. This is a/an study. a. observational b. experimental c. census d. sampling 3. You want to plot a frequency graph of daily rainfall, with rainfalls (inches) on the horizontal axis. You will use a a. bar chart b. histogram c. cumulative frequency d. best fit line 4. Frequency of categorical data are displayed using a a. bar chart b. histogram c. time series graph d. best fit linearrow_forward
arrow_back_ios
SEE MORE QUESTIONS
arrow_forward_ios
Recommended textbooks for you
- MATLAB: An Introduction with ApplicationsStatisticsISBN:9781119256830Author:Amos GilatPublisher:John Wiley & Sons Inc
 Probability and Statistics for Engineering and th...StatisticsISBN:9781305251809Author:Jay L. DevorePublisher:Cengage Learning
 Statistics for The Behavioral Sciences (MindTap C...StatisticsISBN:9781305504912Author:Frederick J Gravetter, Larry B. WallnauPublisher:Cengage Learning
  Elementary Statistics: Picturing the World (7th E...StatisticsISBN:9780134683416Author:Ron Larson, Betsy FarberPublisher:PEARSON
 The Basic Practice of StatisticsStatisticsISBN:9781319042578Author:David S. Moore, William I. Notz, Michael A. FlignerPublisher:W. H. Freeman
 Introduction to the Practice of StatisticsStatisticsISBN:9781319013387Author:David S. Moore, George P. McCabe, Bruce A. CraigPublisher:W. H. Freeman
MATLAB: An Introduction with Applications
Statistics
ISBN:9781119256830
Author:Amos Gilat
Publisher:John Wiley & Sons Inc
Probability and Statistics for Engineering and th...
Statistics
ISBN:9781305251809
Author:Jay L. Devore
Publisher:Cengage Learning
Statistics for The Behavioral Sciences (MindTap C...
Statistics
ISBN:9781305504912
Author:Frederick J Gravetter, Larry B. Wallnau
Publisher:Cengage Learning
Elementary Statistics: Picturing the World (7th E...
Statistics
ISBN:9780134683416
Author:Ron Larson, Betsy Farber
Publisher:PEARSON
The Basic Practice of Statistics
Statistics
ISBN:9781319042578
Author:David S. Moore, William I. Notz, Michael A. Fligner
Publisher:W. H. Freeman
Introduction to the Practice of Statistics
Statistics
ISBN:9781319013387
Author:David S. Moore, George P. McCabe, Bruce A. Craig
Publisher:W. H. Freeman