
MATLAB: An Introduction with Applications
6th Edition
ISBN: 9781119256830
Author: Amos Gilat
Publisher: John Wiley & Sons Inc
expand_more
expand_more
format_list_bulleted
Related questions
Question
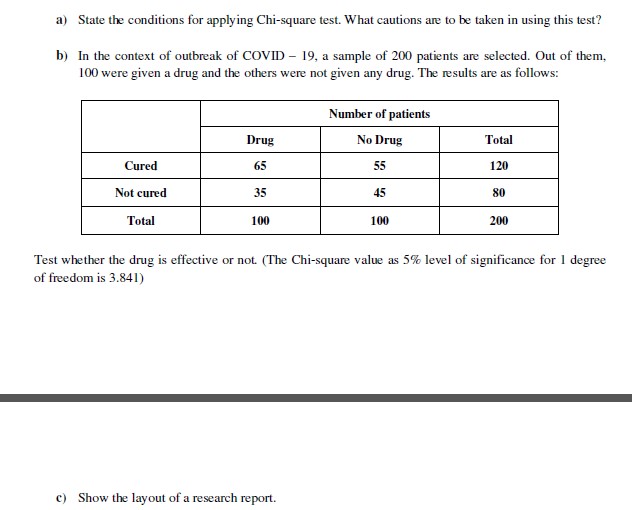

Transcribed Image Text:a) State the conditions for applying Chi-square test. What cautions are to be taken in using this test?
b) In the context of outbreak of COVID - 19, a sample of 200 patients are selected. Out of them,
100 were given a drug and the others were not given any drug. The results are as follows:
Expert Solution
This question has been solved!
Explore an expertly crafted, step-by-step solution for a thorough understanding of key concepts.

This is a popular solution

Trending nowThis is a popular solution!

Step by stepSolved in 3 steps with 8 images

Knowledge Booster


Learn more about
Need a deep-dive on the concept behind this application? Look no further. Learn more about this topic, statistics and related others by exploring similar questions and additional content below.Similar questions
- Researchers investigate how the presence of cell phones influence the quality of human interaction. Subjects are randomly selected from a population and divided into an experimental group that is asked to leave their phones in the front of the room and a control group that are not asked to leave their cell phones at the front of the room. Subjects are left alone for 10 minutes and then asked to take a survey designed to measure quality of interactions they had with others in the experiment. What statistical test is appropriate?arrow_forward#32). Please show work and answers, need to see how it’s done. Thank you!arrow_forwardAn airline operates a call center to handle customer questions and complaints. The airline monitors a sample of calls to help ensure that the service being provided is of high quality. Ten random samples of 100 calls each were monitored under normal conditions. The center can be thought of as being in control when these 10 samples were taken. The number of calls in each sample not resulting in a satisfactory resolution for the customer is as follows. 4 5 3 2 3 3 4 7 4 8 (a) What is an estimate of the proportion of calls not resulting in a satisfactory outcome for the customer when the center is in control? (b) Construct the upper and lower limits for a p chart for the manufacturing process, assuming each sample has 100 calls. (Round your answers to four decimal places.) UCL= LCL= (c) With the results of part (b), what conclusion should be made if a sample of 100 has 12 calls not resulting in a satisfactory resolution for the customer? Since p =____ is (within or…arrow_forward
- In the research design for a (an) _____, each participant experiences all experimental conditions so as to compare differences across conditions a. one-sample t test b. dependent-samples t test c. independent-samples t test d. z testarrow_forwardAn airline operates a call center to handle customer questions and complaints. The airline monitors a sample of calls to help ensure that the service being provided is of high quality. Ten random samples of 100 calls each were monitored under normal conditions. The center can be thought of as being in control when these 10 samples were taken. The number of calls in each sample not resulting in a satisfactory resolution for the customer is as follows. 4 5 3 2 3 3 4 6 4 8 (a) What is an estimate of the proportion of calls not resulting in a satisfactory outcome for the customer when the center is in control? (b) Construct the upper and lower limits for a p chart for the manufacturing process, assuming each sample has 100 calls. (Round your answers to four decimal places.) UCL - LCL = (c) With the results of part (b), what conclusion should be made if a sample of 100 has 13 calls not resulting in a satisfactory resolution for the customer? Since the sample proportion = is --Select- |the…arrow_forwardAcne is a common skin disease that affects most adolescents and can continue into adulthood. A study compared the effectiveness of three acne treatments and a placebo, all in gel form, applied twice daily for 12 weeks. The study's 517 teenage volunteers were randomly assigned to one of the four treatments. Success was assessed as clear or almost clear skin at the end of the 12 week period. The results of the study can be seen in the table below. Using the appropriate statistical test, determine if there is significant evidence that the four treatments perform differently. If so, how do they compare.arrow_forward
- A researcher randomly assigns college freshmen to either of two experimental conditions. Because both groups consist of college freshmen, someone claims that it is appropriate to use a t test for the two related samples. Comments?arrow_forwardA nutritionist in the FDA wants to compare the caloric content of medium French fries sold by Wendonald (Population 1) and McKing (Population 2) fast-food chains, to see if there is any difference between them. To test this, random samples from each chain is taken and the caloric contents of French fries are measured. The finding is summarized in the table on next page. Conduct an independent-samples t test to test whether there is any difference between the caloric content of French fries sold by the two chains, following the steps below. Wendonald McKing = 32 = 30 = 390 calories = 365 calories = 30 calories = 38 calories Write down the null and alternative hypotheses using proper notation Calculate (Write all steps) What is the value of for α = 0.05 with a two-tailed test?arrow_forwardI need help on my classworkarrow_forward
arrow_back_ios
arrow_forward_ios
Recommended textbooks for you
- MATLAB: An Introduction with ApplicationsStatisticsISBN:9781119256830Author:Amos GilatPublisher:John Wiley & Sons Inc
 Probability and Statistics for Engineering and th...StatisticsISBN:9781305251809Author:Jay L. DevorePublisher:Cengage Learning
 Statistics for The Behavioral Sciences (MindTap C...StatisticsISBN:9781305504912Author:Frederick J Gravetter, Larry B. WallnauPublisher:Cengage Learning
  Elementary Statistics: Picturing the World (7th E...StatisticsISBN:9780134683416Author:Ron Larson, Betsy FarberPublisher:PEARSON
 The Basic Practice of StatisticsStatisticsISBN:9781319042578Author:David S. Moore, William I. Notz, Michael A. FlignerPublisher:W. H. Freeman
 Introduction to the Practice of StatisticsStatisticsISBN:9781319013387Author:David S. Moore, George P. McCabe, Bruce A. CraigPublisher:W. H. Freeman
MATLAB: An Introduction with Applications
Statistics
ISBN:9781119256830
Author:Amos Gilat
Publisher:John Wiley & Sons Inc
Probability and Statistics for Engineering and th...
Statistics
ISBN:9781305251809
Author:Jay L. Devore
Publisher:Cengage Learning
Statistics for The Behavioral Sciences (MindTap C...
Statistics
ISBN:9781305504912
Author:Frederick J Gravetter, Larry B. Wallnau
Publisher:Cengage Learning
Elementary Statistics: Picturing the World (7th E...
Statistics
ISBN:9780134683416
Author:Ron Larson, Betsy Farber
Publisher:PEARSON
The Basic Practice of Statistics
Statistics
ISBN:9781319042578
Author:David S. Moore, William I. Notz, Michael A. Fligner
Publisher:W. H. Freeman
Introduction to the Practice of Statistics
Statistics
ISBN:9781319013387
Author:David S. Moore, George P. McCabe, Bruce A. Craig
Publisher:W. H. Freeman