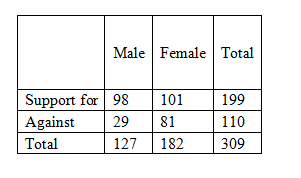
A state is considering legislation to establish a law to help homeless individuals. A sample of 309 individuals regarding their opinions on the potential new law. Is there a relationship between sex and support for this law? Calculate the expected frequencies and compute a chi-square test for a statistically significant relationship between sex and support for the new law. Be sure to round to the second decimal.
|
Sex |
|||
|
|
|
Male |
Female |
|
Support |
For |
98 |
101 |
|
|
Against |
29 |
81 |
Null Hypothesis:
H0: There exists no relationship between gender and support for the law.
Alternative Hypothesis:
H1: There exists a relationship between gender and support for the law.
Test statistic:
Observed values with marginal totals:

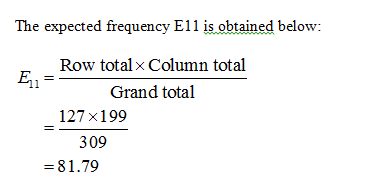
Expected values:
Expected values are the product of the column and row total divided by the table total.

Step by stepSolved in 4 steps with 4 images

- Español According to previous studies, 10% of the U.S. population is left-handed. Not knowing this, a high school student claims that the percentage of left-handed people in the U.S. is 12%. The student is going to take a random sample of 900 people in the U.S. to try to gather evidence to support the claim. Let p be the proportion of left-handed people in the sample. Answer the following. (If necessary, consult a list of formulas.) (a) Find the mean of p. 0.12 (b) Find the standard deviation of p. X 5 (c) Compute an approximation for P(p≤0.12), which is the probability that there will be 12% or fewer left-handed people in the sample. Round your answer to four decimal places. A 27arrow_forwardA 2010 Pew Research poll asked 1,306 Americans "From what you've read and heard, is there solid evidence that the average temperature on earth has been getting warmer over the past few decades, or not?". The table below shows the distribution of responses by party and ideology, where the counts have been replaced with relative frequencies. Earth is warming Not warming Don't know (or refuse) Total Conservative Republican 0.11 0.2 0.02 0.33 Mod/Lib Republican 0.06 0.06 0.01 0.13 Mod/Cons Democrat 0.25 0.07 0.02 0.34 Liberal Democrat 0.18 0.01 0.01 0.2 Total 0.6 0.34 0.06 1 a) Are believing that the earth is warming and being a liberal Democrat mutually exclusive? not mutually exclusive mutually exclusive Incorrect b) What is the probability that a randomly chosen respondent believes the earth is warming or is a liberal Democrat? (please round to four decimal places)c) What is the probability that a randomly chosen respondent believes the earth is warming given…arrow_forwardA political scientist claims that 38% of first-year college students characterize themselves as being “moderate” or “middle of the road” as far as their political affiliation is concerned. Believing this claimed value is too high, you survey a random sample of 400 first-year college students and find that 120 characterize themselves as being “moderate” or “middle of the road.” Based on this information, what will the test statistic be? Choose the answer below that is closest to what you calculate, and try not to do a lot of rounding until you get to the very end of your calculations. 1. -0.3 2. -1.2 3. -2.6 4. -3.3 5. None of the other answer options are correct because the test statistic should be positive, not negative.arrow_forward
- A survey of property owners' opinions about a street-widening project was taken to determine if owners' opinions were related to the distance between their home and the street. A randomly selected sample of 100 property owners was contacted and the results are shown next. Opinion Front Footage For Undecided Against Under 45 feet 12 4 4 45-120 feet 35 5 30 Over 120 feet 3 2 5 What is the expected frequency for people against the project and who have over 120 feet of property foot-frontage? Select one: a. 1.1 b. 3.9 c. 5.0 d. 5.5arrow_forwardA poll found that 80% of American adults believed that there was a conspiracy in the death of President Kennedy. A later poll asked 1097 American adults if they believe there was a conspiracy in the assassination, and found that 834 believe there was a conspiracy. Do the data show that the proportion of Americans who believe in this conspiracy has decreased? Test at the 1% level. State the hypotheses. Họ: P ?v H,: P ?v Calculate the test statistic. Round to four decimal places. p = Calculate the standardized test statistic. Round to three decimal places. Z = Find the p-value. Round to four decimal places. p-value = State your decision. O Since the p-value is greater than .01, fail to reject Ho. O Since the p-value is less than .01, fail to reject Ho. O Since the p-value is less than .01, reject Họ- O Since the p-value is greater than .01, reject Ho. Interpret the results. O At the 1% level of significance, there is not enough evidence to show that the proportion of American adults who…arrow_forwardAccording to previous studies, 12% of the U.S. population is left-handed. Not knowing this, a high school student claims that the percentage of left-handed people in the U.S. is 14%. The student is going to take a random sample of 1650 people in the U.S. to try to gather evidence to support the claim. Let p be the proportion of left-handed people in the sample. Answer the following. (If necessary, consult a list of formulas.) ✔ (a) Find the mean of p. P. 0 (b) Find the standard deviation of p. (c) Compute an approximation for P (P<0.14), which is the probability that there will be 14% or fewer left-handed people in the sample. Round your answer to four decimal places. Xarrow_forward
- A teacher asks 200 volunteers to compete a survey. Responses to the question "do you own a car" (yes or no) were recorded. Please explain why this is not a binomial distribution.arrow_forwardAnxiety when taking math tests is a common problem. If I want to study this issue, which of the following describes the best way to find out the proportion of students who suffer from math anxiety? O Select students who have scored poorly in math classes at CCBC. Poll students as they enter campus on a randomly selected day. Talk to students randomly pulled from the list of all students. Interview students who have finals on the first day of finals week.arrow_forwardHi I am having trouble answering letter D. Thank you.arrow_forward
 MATLAB: An Introduction with ApplicationsStatisticsISBN:9781119256830Author:Amos GilatPublisher:John Wiley & Sons Inc
 Probability and Statistics for Engineering and th...StatisticsISBN:9781305251809Author:Jay L. DevorePublisher:Cengage Learning
 Statistics for The Behavioral Sciences (MindTap C...StatisticsISBN:9781305504912Author:Frederick J Gravetter, Larry B. WallnauPublisher:Cengage Learning
 Elementary Statistics: Picturing the World (7th E...StatisticsISBN:9780134683416Author:Ron Larson, Betsy FarberPublisher:PEARSON
 The Basic Practice of StatisticsStatisticsISBN:9781319042578Author:David S. Moore, William I. Notz, Michael A. FlignerPublisher:W. H. Freeman
 Introduction to the Practice of StatisticsStatisticsISBN:9781319013387Author:David S. Moore, George P. McCabe, Bruce A. CraigPublisher:W. H. Freeman


