
MATLAB: An Introduction with Applications
6th Edition
ISBN: 9781119256830
Author: Amos Gilat
Publisher: John Wiley & Sons Inc
expand_more
expand_more
format_list_bulleted
Related questions
Question
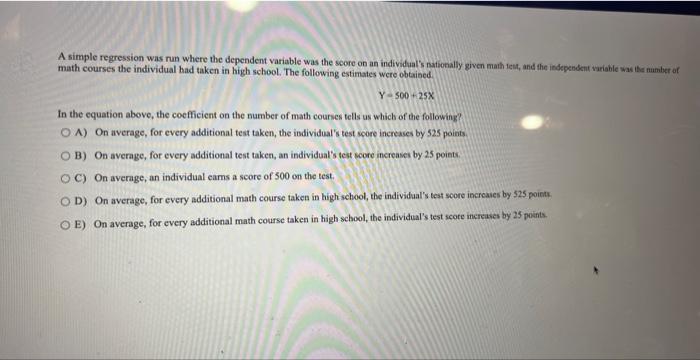

Transcribed Image Text:A simple regression was run where the dependent variable was the score on an individual's nationally given math test, and the independent variable was the number of
math courses the individual had taken in high school. The following estimates were obtained.
Y-500 25X
In the equation above, the coefficient on the number of math courses tells us which of the following?
OA) On average, for every additional test taken, the individual's test score increases by 525 points.
OB) On average, for every additional test taken, an individual's test score increases by 25 points.
OC) On average, an individual carns a score of 500 on the test.
OD) On average, for every additional math course taken in high school, the individual's test score increases by 525 points.
OE) On average, for every additional math course taken in high school, the individual's test score increases by 25 points.
Expert Solution
This question has been solved!
Explore an expertly crafted, step-by-step solution for a thorough understanding of key concepts.

Step by stepSolved in 2 steps with 1 images

Knowledge Booster

Similar questions
- A regression was run to determine if there is a relationship between hours of TV watched per day (x) and number of situps a person can do (y).The results of the regression were:y=ax+b a=-0.96 b=35.944 r2=0.736164 r=-0.858 Use this to predict the number of situps a person who watches 10.5 hours of TV can do (to one decimal place)arrow_forwardA regression analysis was performed to determine if there is a relationship between hours of TV watched per day (2) and number of sit ups a person can do (y). The results of the regression were: y=ax+b a=-0.666 b=21.511 72=0.543169 r=-0.737 Use this to predict the number of sit ups a person who watches 7 hours of TV can do, and please round your answer to a whole number. Hìnt: Help Question Help: Message instructor Submit Question 围 hp Ce %23 & 3. 4. 6. 8. W e y 61arrow_forwardA real estate company wanted to see the relationship between home prices and square footage of homes for sale. The regression line is ŷ = –802,456 + 144x, where x is the square footage of a home. Complete the statement based on the information. For every -square-foot increase, the predicted home price is predicted to increase by $arrow_forward
- You work as a data scientist for a real estate company in a seaside resort town. Your boss has asked you to discover if it's possible to predict how much a home's distance from the water affects its selling price. You are going to collect a random sample of 7 recently sold homes in your town. You will note the distance each home is from the water (denoted by x, in km) and each home's selling price (denoted by y, in hundreds of thousands of dollars). You will also note the product x.y of the distance from the water and selling price for each home. (These products are written in the row labeled "xy"). (a) Click on "Take Sample" to see the results for your random sample. Distance from the water, .x (in km) Take Sample Selling price, y (in hundreds of thousands of dollars) xy Send data to calculator Based on the data from your sample, enter the indicated values in the column on the left below. Round decimal values to three decimal places. When you are done, select "Compute". (In the table…arrow_forwardSee below.arrow_forwardA pediatrician wants to determine the relation that exists between a child's height (x) and head circumference (y). She randomly selects 11 children from her practice and measures their height and head circumference in inches. She finds that the correlation is 0.477 and the regression equation is y = 0.149x + 8.15 What proportion of the variation in head circumference can be explained by the variation in the values of height? % Report answer as a percentage accurate to one decimal place.arrow_forward
- I’m taking a statistics and probability class. Please get this correct because I want to learn. I have gotten wrong answers on here beforearrow_forwardThe line of best fit through a set of data is y = -23.849 + 0.834x According to this equation, what is the predicted value of the dependent variable when the independent variable has value 10? y = decimal place. Round to 1arrow_forwardPlease all the 3 of these sub-questions. Make sure answer is rounded up to 4 decimalsarrow_forward
- The y for the association between education and health is -0.386. Does y for the relationship between frequency of prayer and health (-.055) represent a stronger or weaker ordinal association then the y of -0.386 for the relationship between education and health? Options: A. stronger relationship than y of -0.386 B. Weaker relationship than y of 0.386 C. cant tell from the information providedarrow_forwardUtilizing the previous table: A sample of 25 cities have been classified as high or low on their homicide rates and the number of handguns sold within the city limits. How would you classify the strength of the relationship?arrow_forwardA regression was run to determine if there is a relationship between hours of TV watched per day (x) and number of situps a person can do (y).The results of the regression were: y=a+bx b=-0.997 a=20.107 r2=0.950625 r=-0.975 Use this to predict the number of situps a person who watches 0.5 hours of TV can do.Round to one decimal place.arrow_forward
arrow_back_ios
SEE MORE QUESTIONS
arrow_forward_ios
Recommended textbooks for you
- MATLAB: An Introduction with ApplicationsStatisticsISBN:9781119256830Author:Amos GilatPublisher:John Wiley & Sons Inc
 Probability and Statistics for Engineering and th...StatisticsISBN:9781305251809Author:Jay L. DevorePublisher:Cengage Learning
 Statistics for The Behavioral Sciences (MindTap C...StatisticsISBN:9781305504912Author:Frederick J Gravetter, Larry B. WallnauPublisher:Cengage Learning
  Elementary Statistics: Picturing the World (7th E...StatisticsISBN:9780134683416Author:Ron Larson, Betsy FarberPublisher:PEARSON
 The Basic Practice of StatisticsStatisticsISBN:9781319042578Author:David S. Moore, William I. Notz, Michael A. FlignerPublisher:W. H. Freeman
 Introduction to the Practice of StatisticsStatisticsISBN:9781319013387Author:David S. Moore, George P. McCabe, Bruce A. CraigPublisher:W. H. Freeman
MATLAB: An Introduction with Applications
Statistics
ISBN:9781119256830
Author:Amos Gilat
Publisher:John Wiley & Sons Inc
Probability and Statistics for Engineering and th...
Statistics
ISBN:9781305251809
Author:Jay L. Devore
Publisher:Cengage Learning
Statistics for The Behavioral Sciences (MindTap C...
Statistics
ISBN:9781305504912
Author:Frederick J Gravetter, Larry B. Wallnau
Publisher:Cengage Learning
Elementary Statistics: Picturing the World (7th E...
Statistics
ISBN:9780134683416
Author:Ron Larson, Betsy Farber
Publisher:PEARSON
The Basic Practice of Statistics
Statistics
ISBN:9781319042578
Author:David S. Moore, William I. Notz, Michael A. Fligner
Publisher:W. H. Freeman
Introduction to the Practice of Statistics
Statistics
ISBN:9781319013387
Author:David S. Moore, George P. McCabe, Bruce A. Craig
Publisher:W. H. Freeman