
MATLAB: An Introduction with Applications
6th Edition
ISBN: 9781119256830
Author: Amos Gilat
Publisher: John Wiley & Sons Inc
expand_more
expand_more
format_list_bulleted
Related questions
Question
thumb_up100%
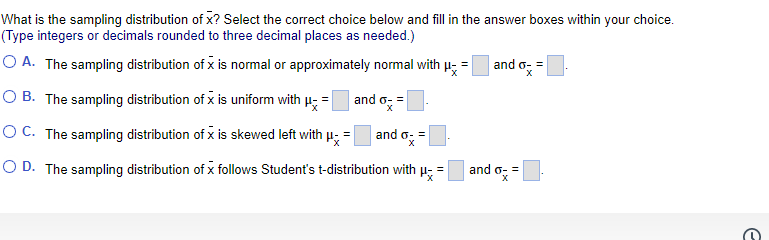

Transcribed Image Text:What is the sampling distribution of x? Select the correct choice below and fill in the answer boxes within your choice.
(Type integers or decimals rounded to three decimal places as needed.)
O A. The sampling distribution of x is normal or approximately normal with µ
and o- =
O B. The sampling distribution of x is uniform with μ- =
R
O C. The sampling distribution of x is skewed left with μ
=
and o- =
x
OD. The sampling distribution of x follows Student's t-distribution with
P
and o- =
X
and o
σ-=

Transcribed Image Text:A simple random sample of size n = 76 is obtained from a population with μ = 60 and o=2. Does the population need to be normally distributed for the sampling distribution of x to b
approximately normally distributed? Why? What is the sampling distribution of X?
C
Does the population need to be normally distributed for the sampling distribution of x to be approximately normally distributed? Why?
O A. Yes because the Central Limit Theorem states that only for underlying populations that are normal is the shape of the sampling distribution of x normal, regardless of the
sample size, n.
O B. No because the Central Limit Theorem states that regardless of the shape of the underlying population, the sampling distribution of x becomes approximately normal as
the sample size, n, increases.
O C.
No because the Central Limit Theorem states that only if the shape of the underlying population is normal or uniform does the sampling distribution of x become
approximately normal as the sample size, n, increases.
O D. Yes because the Central Limit Theorem states that the sampling variability of nonnormal populations will increase as the sample size increases.
What is the sampling distribution of X? Select the correct choice below and fill in the answer boxes within your choice.
(Type integers or decimals rounded to three decimal places as needed.)
O A. The sampling distribution of x is normal or approximately normal with
OB. The sampling distribution of x is uniform with µ- =
and o-=
and o-=
Expert Solution
This question has been solved!
Explore an expertly crafted, step-by-step solution for a thorough understanding of key concepts.

This is a popular solution

Trending nowThis is a popular solution!

Step by stepSolved in 3 steps

Knowledge Booster

Similar questions
- The graph to the right portrays the decision criterion for a hypothesis test for a population mean u. The null hypothesis for the test is Ho:=Ho- The curve in the graph is the normal curve for the test statistic under the assumption that the null hypothesis is true. Complete parts (a) through (f) below. Reject | Do not reject Ho Ho I 0.04 -1.751 0 a. Determine the rejection region. OA. z> -1.751 O B. z>1.751 O C. zs - 1.751 OD. zs-1.751 or z2 1.751 b. Determine the nonrejection region. A. - 1.751 szS1.751 Question Viewer O B. B. - 1.751 -1.751 c. Determine the critical value(s). (Type integers or decimals. Do not round. Use a comma to separate answers as needed.) Click to select your answer(s). MacBook Pro F1 F2 F3 DII DD F4 F5 F6 F7 F8 F9 F10 23 & 4. 00 %24 2.arrow_forwardA simple random sample of size n = 37 is obtained from a population that is skewed left with µ = 31 and o=4. Does the population need to be normally distributed for the sampling distribution of x to be approximately normally distributed? Why? What is the sampling distribution of x? Does the population need to be normally distributed for the sampling distribution of x to be approximately normally distributed? Why? A. Yes. The central limit theorem states that the sampling variability of nonnormal populations will increase as the sample size increases. B. No. The central limit theorem states that only if the shape of the underlying population is normal or uniform does the sampling distribution of x become approximately normal as the sample size, n, increases. C. No. The central limit theorem states that regardless of the shape of the underlying population, the sampling distribution of x becomes approximately normal as the sample size, n, increases. D. Yes. The central limit theorem…arrow_forwardThe third worksheet labeled sample B is a simple random sample with replacement, with seven observations in the sample, from some population. The index i in the first column is just an integer name for each observation. The specific values x in the second column are measures of a random variable X distributed in the population. Now suppose this random variable X is known to have a Normal distribution in the sampled population. You still do not know the population mean and must estimate it from the sample, as you did earlier. BUT NOW, in this question, you know in advance that the true population standard deviation of the random variable X is 4. Compute the standard error (of the sample mean), given this new knowledge situation. i xi 1 74.2 2 72.79 3 70.35 4 74.37 5 73.34 6 78.96 7 77.99arrow_forward
- A simple random sample of size n= 32 is obtained from a population that is skewed left with u = 58 and o = 10. Does the population need to be normally distributed for the sampling distribution of x to be approximately normally distributed? Why? What is the sampling distribution of x? Does the population need to be normally distributed for the sampling distribution of x to be approximately normally distributed? Why? O A. Yes. The central limit theorem states that the sampling variability of nonnormal populations will increase as the sample size increases. O B. Yes. The central limit theorem states that only for underlying populations that are normal is the shape of the sampling distribution of x normal, regardless of the sample size,n. O C. No. The central limit theorem states that regardless of the shape of the underlying population, the sampling distribution of x becomes approximately normal as the sample size, n, increases. O D. No. The central limit theorem states that only if the…arrow_forward3. For the binomial distribution with the given values for n and p, state whether or not it is suitable to use the normal distribution as an approximation. n= 65 and p = 0.7 a. Normal approximation is not suitable. b. Normal approximation is suitable.arrow_forwardtime, i.e. P(μx-ox ≤ x ≤ μx + 0x). 3. Suppose that people heights are normally distributed with mean of 170 cm and standard deviation of 6 cm. a) What proportion of people are between 165 cm and 175 cm tall? b) Find the minimum ceiling of an airplane such that at most 5% of people walking down the aisle will have to duck. E c) Find the probability that the average height of a random sample of 49 people is greater than 172 cm. 80 F3 4 R % 5 T F6 Y 1 & 7 K ard deviation of the expected U 8 DIIarrow_forward
- For the population whose distribution is Uniformly distributed from 30 to 52, random samples of size n = 39 are repeatedly taken. Compute u and round to two decimals. Use this value to find the following. Round answers to three decimals if needed. Answers of 0 and 1 are possible due to rounding. a. P(40 < < 43): b. The 25th percentile for sample means: Submit Questionarrow_forwardA simple random sample of size n = 50 is obtained from a population that is skewed left with μ=41 and o=7. Does the population need to be normally distributed for the sampling distribution of x to be approximately normally distributed? Why? What is the sampling distribution of x? Does the population need to be normally distributed for the sampling distribution of x to be approximately normally distributed? Why? O A. Yes. The central limit theorem states that the sampling variability of nonnormal populations will increase as the sample size increases. OB. No. The central limit theorem states that only if the shape of the underlying population is normal or uniform does the sampling distribution of x become approximately normal as the sample size, n, increases. O C. No. The central limit theorem states that regardless of the shape of the underlying population, the sampling distribution of x becomes approximately normal as the sample size, n, increases. O D. Yes. The central limit theorem…arrow_forwardThe heights of fully grown trees of a specific species are normally distributed, with a mean of 54.5 feet and a standard deviation of 5.75 feet. Random samples of size 19 are drawn from the population. Use the central limit theorem to find the mean and standard error of the sampling distribution. Then sketch a graph of the sampling distribution. The mean of the sampling distribution is u- %3D The standard error of the sampling distribution is o, = X. (Round to two decimal places as needed.) Choose the correct graph of the sampling distribution below. O A. В. OC. 2. 51.9 54.5 57.1 43.0 54.5 66.0arrow_forward
- Suppose a simple random sample of size n = 200 is obtained from a population whose size is N = 20,000 and whose population proportion with a specified characteristic isp=D0.2. Complete parts (a) through (c) below. (a) Describe the sampling distribution of p. Choose the phrase that best describes the shape of the sampling distribution below. O A. Approximately normal because ns0.05N and np(1 - p)< 10. O B. Not normal becausens0.05N and np(1- p)< 10. O C. Not normal because ns0.05N and np(1-p)2 10. OD. Approximately normal because ns0.05N and np(1 - p) 2 10. Determine the mean of the sampling distribution of p. HA = 0.2 (Round to one decimal place as needed.) Determine the standard deviation of the sampling distribution of p. GA = (Round to six decimal places as needed.)arrow_forwardFor the population whose distribution is Uniformly distributed from 35 to 45, random samples of size n = 34 are repeatedly taken. Compute u and round to two decimals. Use this value to find the following. Round answers to three decimals if needed. Answers of 0 and 1 are possible due to rounding. a. P(41 < a < 43): b. The 15th percentile for sample means: Submit Question rarrow_forwardPeter is trying to figure out the sample size for the data set he wants to collect. He is considering having the bound on the error of estimation to be either 3.5 or 4.5. Explain to Peter the impact these different errors will have on his sample size.arrow_forward
arrow_back_ios
arrow_forward_ios
Recommended textbooks for you
- MATLAB: An Introduction with ApplicationsStatisticsISBN:9781119256830Author:Amos GilatPublisher:John Wiley & Sons Inc
 Probability and Statistics for Engineering and th...StatisticsISBN:9781305251809Author:Jay L. DevorePublisher:Cengage Learning
 Statistics for The Behavioral Sciences (MindTap C...StatisticsISBN:9781305504912Author:Frederick J Gravetter, Larry B. WallnauPublisher:Cengage Learning
  Elementary Statistics: Picturing the World (7th E...StatisticsISBN:9780134683416Author:Ron Larson, Betsy FarberPublisher:PEARSON
 The Basic Practice of StatisticsStatisticsISBN:9781319042578Author:David S. Moore, William I. Notz, Michael A. FlignerPublisher:W. H. Freeman
 Introduction to the Practice of StatisticsStatisticsISBN:9781319013387Author:David S. Moore, George P. McCabe, Bruce A. CraigPublisher:W. H. Freeman
MATLAB: An Introduction with Applications
Statistics
ISBN:9781119256830
Author:Amos Gilat
Publisher:John Wiley & Sons Inc
Probability and Statistics for Engineering and th...
Statistics
ISBN:9781305251809
Author:Jay L. Devore
Publisher:Cengage Learning
Statistics for The Behavioral Sciences (MindTap C...
Statistics
ISBN:9781305504912
Author:Frederick J Gravetter, Larry B. Wallnau
Publisher:Cengage Learning
Elementary Statistics: Picturing the World (7th E...
Statistics
ISBN:9780134683416
Author:Ron Larson, Betsy Farber
Publisher:PEARSON
The Basic Practice of Statistics
Statistics
ISBN:9781319042578
Author:David S. Moore, William I. Notz, Michael A. Fligner
Publisher:W. H. Freeman
Introduction to the Practice of Statistics
Statistics
ISBN:9781319013387
Author:David S. Moore, George P. McCabe, Bruce A. Craig
Publisher:W. H. Freeman